The tropical cyclone chapters of my 2010 Florida State University dissertation, republished exactly as written.
They cover energy metrics and their limits, why reanalyses couldn't measure hurricane power, storm size, ENSO, the
2007–2009 collapse in global activity, and extratropical transition. After them: what the field has learned since, and what
could come next.
Maue, R. N. (2010).Warm Seclusion Extratropical Cyclones. Ph.D. dissertation, The Florida State
University, Department of Meteorology. Advisor: M. A. Bourassa. Defended May 28, 2010.
The dissertation was about warm seclusion extratropical cyclones. It also had a thread on tropical
cyclones: how they transition into the midlatitudes, how their energy should be measured, and how climate modulates them.
That thread is collected here: the Abstract, §2.4, §4.2 and all of Chapter 7, with 42 original figures and six tables.
Republished without changes. Text, headings,
figure captions, table contents and references are exactly as submitted in 2010, including their original wording and
spelling. Figures and tables appear after their first mention instead of at the end of each chapter. Equations are
re-typeset from the equation-editor originals. Grey marks in the margin give the original page numbers. Editor’s
comments appear only in Part II.
p. xxiThe warm seclusion or mature stage of the extratropical cyclone lifecycle often has structural characteristics reminiscent of major tropical cyclones including eye-like moats of calm air at the barotropic warm-core center surrounded by hurricane force winds along the bent-back warm front. Many extratropical cyclones experience periods of explosive intensification or deepening (bomb) as a result of nonlinear dynamical feedbacks associated with latent heat release. Considerable dynamical structure changes occur during short time periods of several hours in which lower stratospheric and upper-tropospheric origin potential vorticity combines with ephemeral lower-tropospheric, diabatically generated potential vorticity to form a coherent, upright tower circulation. At the center, anomalously warm and moist air relative to the surrounding environment is secluded and may exist for days into the future. Even with the considerable body of research conducted during the last century, many questions remain concerning the warm seclusion process. The focus of this work is on the diagnosis, climatology, and synoptic-dynamic development of the warm seclusion and surrounding flank of intense winds.
To develop a climatology of warm seclusion and explosive extratropical cyclones, current long-period reanalysis datasets are utilized along with storm tracking procedures and cyclone phase space diagnostics. Limitations of the reanalysis products are discussed with special focus on tropical cyclone diagnosis and the recent dramatic decrease in global accumulated tropical cyclone energy. A large selection of case studies is simulated with the Weather Research and Forecasting (WRF) mesoscale model using full-physics and “fake dry” adiabatic runs in order to capture the very fast warm seclusion development. Results are presented concerning the critical role of latent heat release and the combination of advective and diabatically generated potential vorticity in the generation of the coherent tower circulation characteristic of the warm seclusion. To motivate future research, issues related to predictability are discussed with focus on medium-range forecasts of varying extratropical cyclone lifecycles. Additional work is presented relating tropical cyclones and large-scale climate variability with special emphasis on the abrupt and dramatic decline in recent global tropical cyclone accumulated cyclone energy.
From Chapter 2, Extratropical Cyclone Lifecycles
#2.4 Extratropical Transition Re-intensification as a Warm Seclusion
p. 22Warm seclusion extratropical cyclones can develop from the extratropical transition (ET) of poleward progressing tropical cyclones (TC). Since the reanalysis storm track databases also will include many TCs, a cursory goal of this study will be to identify and classify recurving TCs which undergo ET and explosively intensify into mature extratropical warm seclusions. There is considerable ongoing work by many researchers related to the predictability of ET outcome, i.e. if a TC will decay in unfavorable baroclinic environments of high vertical shear or be able to maintain its vorticity intensity or possibly reintensify rapidly (Jones et al. 2003). Hart et al. (2006) reported on synoptic composites of various Atlantic ET outcomes with operational numerical weather prediction (NWP) model cyclone phase space diagnostic trajectories (CPS; Hart 2003). This work will be extended to the Pacific basin with emphasis on those TCs which undergo rapid intensification during the past 30-years with the MERRA reanalysis.
As a TC reaches its recurvature latitude, considerable uncertainty in downstream NWP forecasts occurs probably as a result of the rapid and poorly predicted evolution of Rossby wave packets (e.g. Harr and Dea 2009). When ensemble spread the geopotential fields at 500 hPa are examined during ET cases in the Western Pacific, it is often observed that large downstream uncertainty exists in continental United States forecasts 5-days in the future. The TIGGE ensemble archive is expected to be an invaluable resource to identify and diagnose the source of upstream errors associated with ET. As described in Chapter 6, the possibility that large analysis error in NWP initialization fields may be associated with future forecast error is likely intimately related to the orientation of the large-scale circulation likely due to downstream development, as one example (Orlanski and Sheldon 1995).
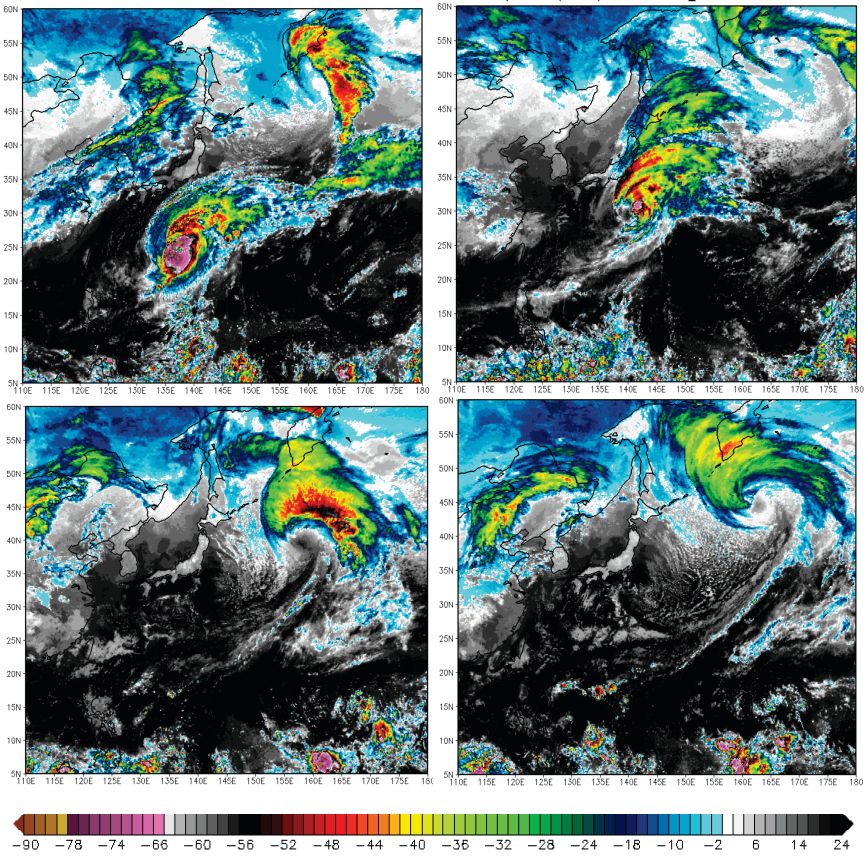
A remarkable ET reintensification occurred with Typhoon Forrest during late October 1989 in the Western North Pacific with the final extratropical low reaching a much lower central sea-level pressure than anytime during its tropical phase. Cyclone phase space diagnostics (Hart 2003) from MERRA (c.f. §3.2.8) show the ET of Forrest on the 29 October and the reintensification as a deep warm seclusion. A series of enhanced-infrared images (Figure 2.14 a-d) from the ISCCP geostationary satellite archives characterize the archetype ET process from mature tropical cyclone into the baroclinic shear zone and rapid re-intensification (e.g. Harr and Elsberry 2000; Hart and Evans 2001). The intense convection in the cloud head (Figure 2.14c) surrounds a relatively cloud-free dry slot during the frontal-fracture and T-bone stage (Shapiro and Keyser 1990) until maturing as a warm seclusion with a weak trailing cold-front (Figure 2.14d). Considerable dry air spills off the continent, over the Sea of Japan, and into the cold-sector of the sprawling cyclone.
Figure 2.14: Typhoon Forrest IR Satellite Imagery GMS-3 Satellite (shaded, °C), October 1989 at (a) 27/12z (b) 28/12Z (c) 29/12Z and (d) 29/21Z. p. 38
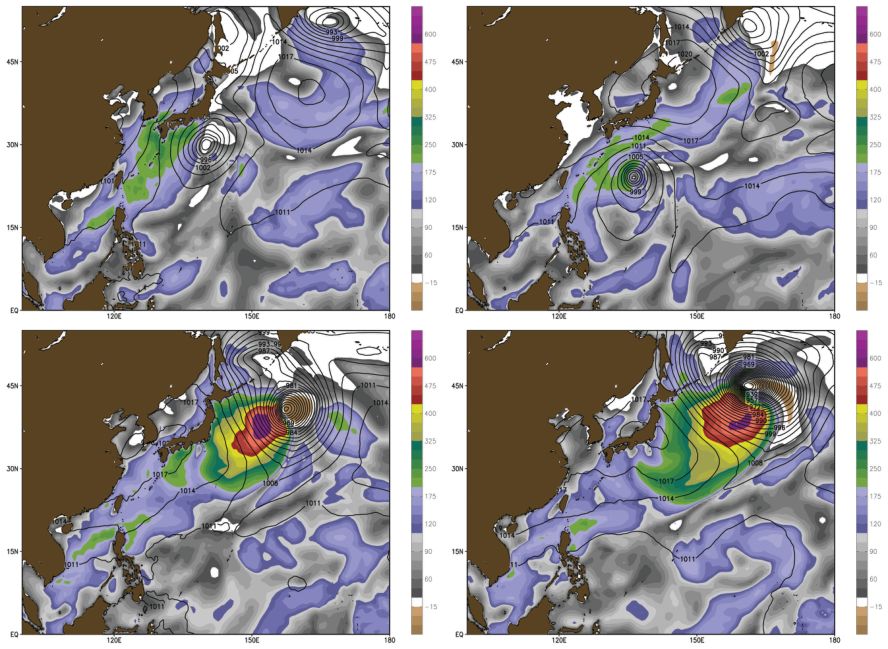
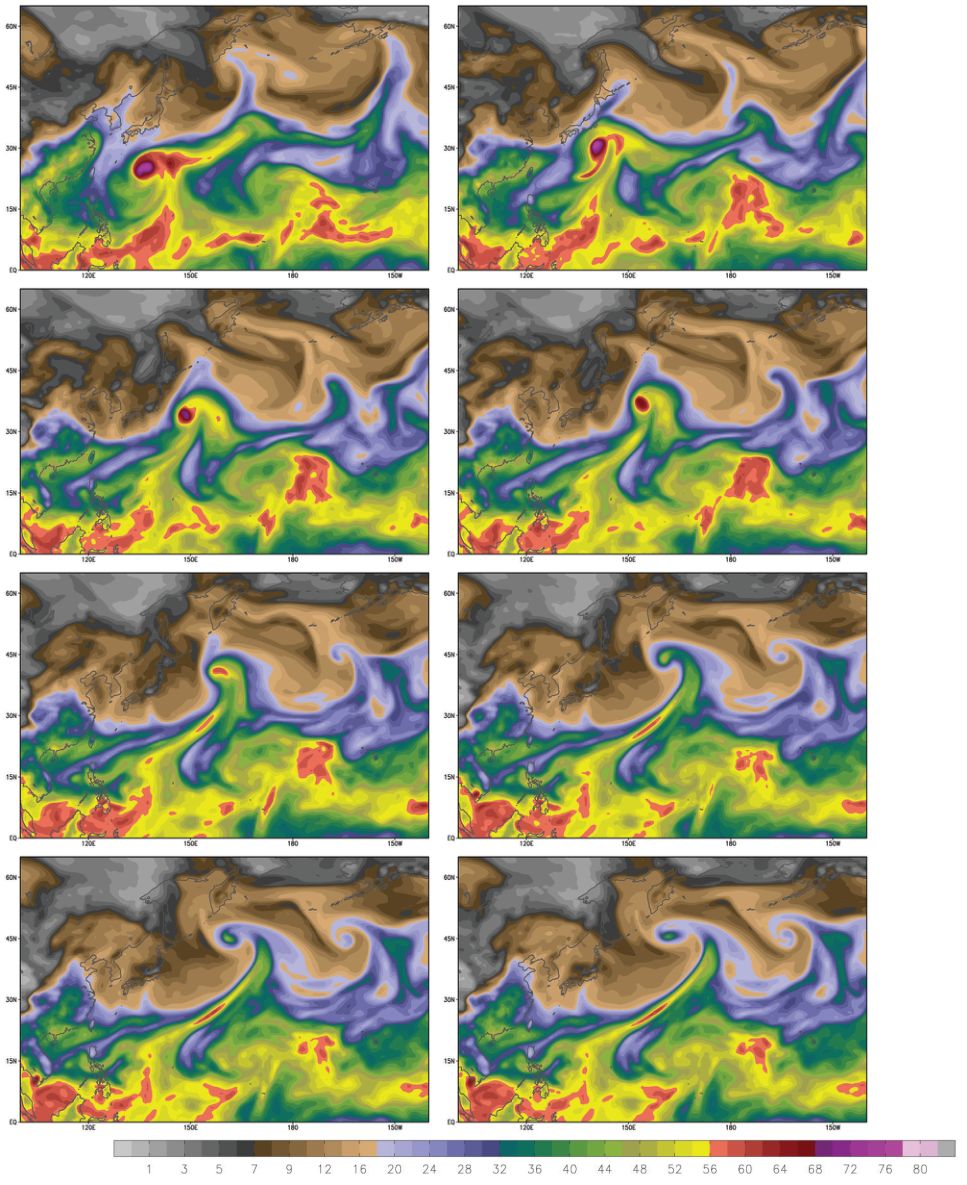
p. 23During the extratropical transition process, surface fluxes are critical for the maintenance of convection and the intensity of the lower-level PV tower which may be maintained during the transition process (c.f. §2.3.8). Diagnostics from the MERRA reanalysis are shown in the panel of Figures 3.6 at 0.5º x 0.66º grid spacing. The shaded contours are latent heat flux (positive upwards) with sea-level pressure contours overlaid during a 60-hour period. Typhoon Forrest approaches the southern coast of Japan (Figure 2.15 a-b) and its near-surface circulation represents an advection dipole with weak upward latent heat flux west of the circulation center. Just after the completion of extratropical transition (Figure 2.15c, 29/12z), ex-Forrest explosively deepens with a broad area of large latent heat flux upward from the surface, likely underestimated due to the relative coarseness of the MERRA grids. The final seclusion phase with the strong upward fluxes (Figure 2.15d) corresponded with the IR satellite imagery and the flooding of cold air over the warmer ocean surface. A concomitant series of precipitable water figures depict the very moist, deep convection associated with the Forrest prior to transition with the upper-level outflow extending poleward into the circulation of a mature extratropical cyclone south of Kamchatka peninsula (Figure 2.16a). As Forrest recurved east of Japan (Figure 2.16b) and completed extratropical transition (Figure 2.16c), the magnitude of the precipitable water decreased markedly with the translation of the storm over cooler SSTs. A strong and narrow moisture river extends out of the tropics into the midlatitudes making up the warm conveyor belt of the rapid re-intensifying extratropical version of Forrest. At maturity (Figure 2.16d) in the warm seclusion stage, the center of Forrest appears has maintained anomalously high moisture content, presumably the remnants of the tropical core during the tropical stage of Forrest.
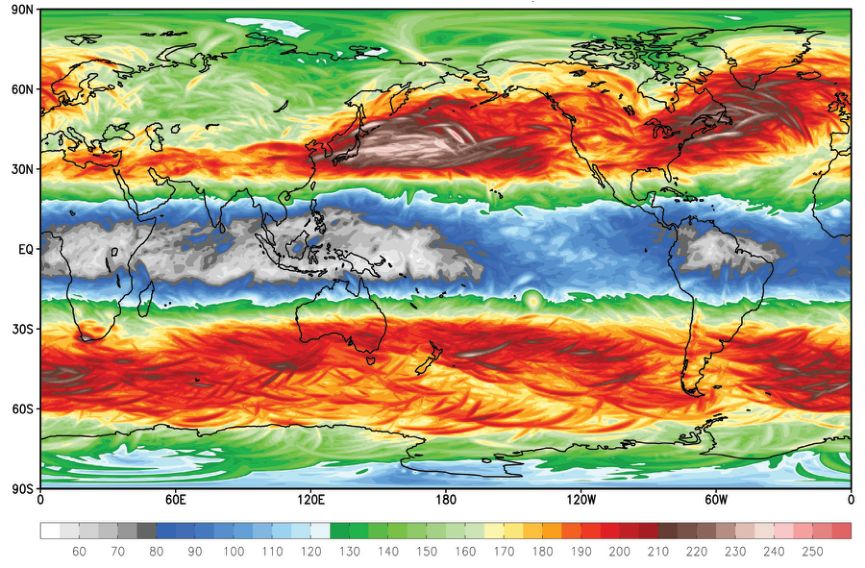
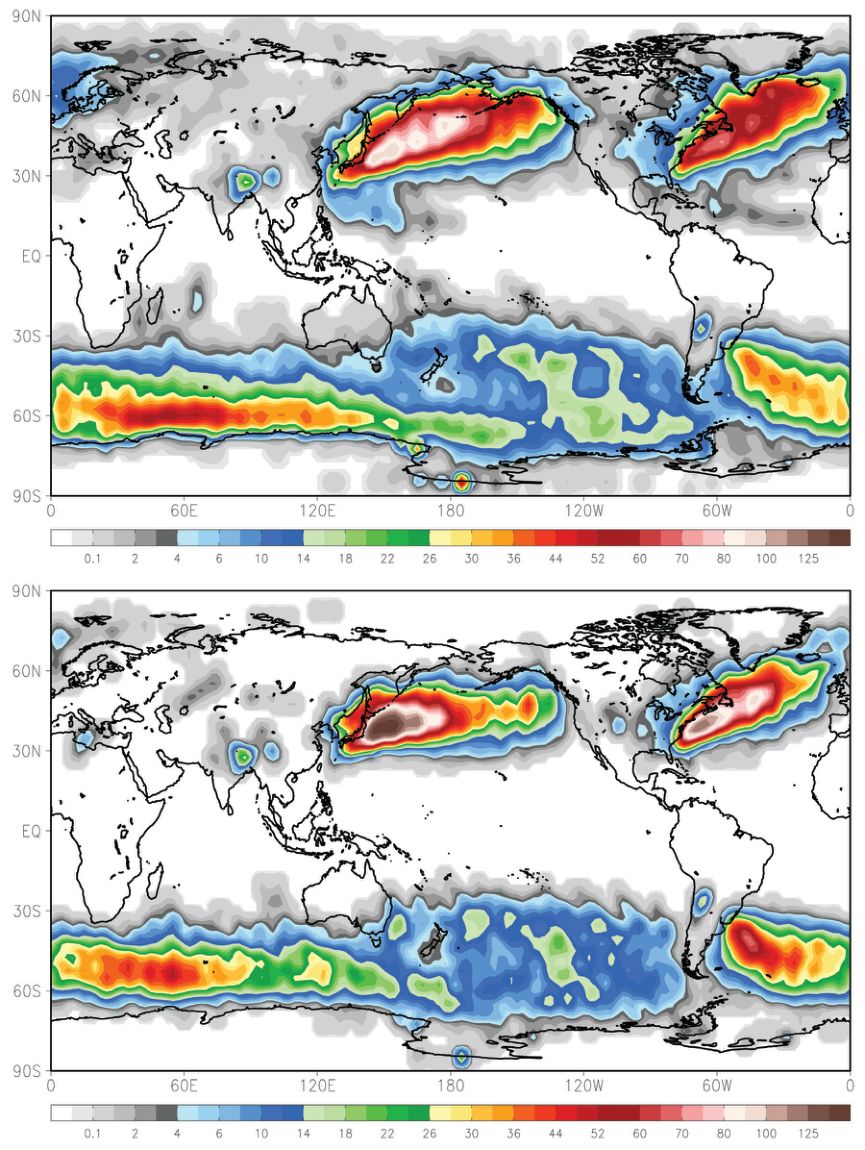
Figure 3.6: Same as 3.4 except for 250-hPa level wind speed (shaded, knots) with a maximum analyzed speed of 251 knots p. 63, 64Figure 2.15: Extratropical transition of Typhoon Forrest (October 1989): Hourly MERRA surface latent heat flux (Wm-2) analysis of the development of warm seclusion and bent-back warm front over a 10 hour period in which the sea-level pressure (MSLP, hPa contours) fell from 950 to 918 hPa for the times (a) 27/12z (b) 28/12Z (c) 29/12Z and (d) 29/21Z. p. 39Figure 2.16: Total column precipitable water (kg m-2) during Typhoon Forrest’s extratropical transition from the MERRA 1-hourly reanalysis fields during October 1989 at (a) 27/12Z (b) 28/12Z (c) 29/12Z and (d) 29/21Z. p. 40
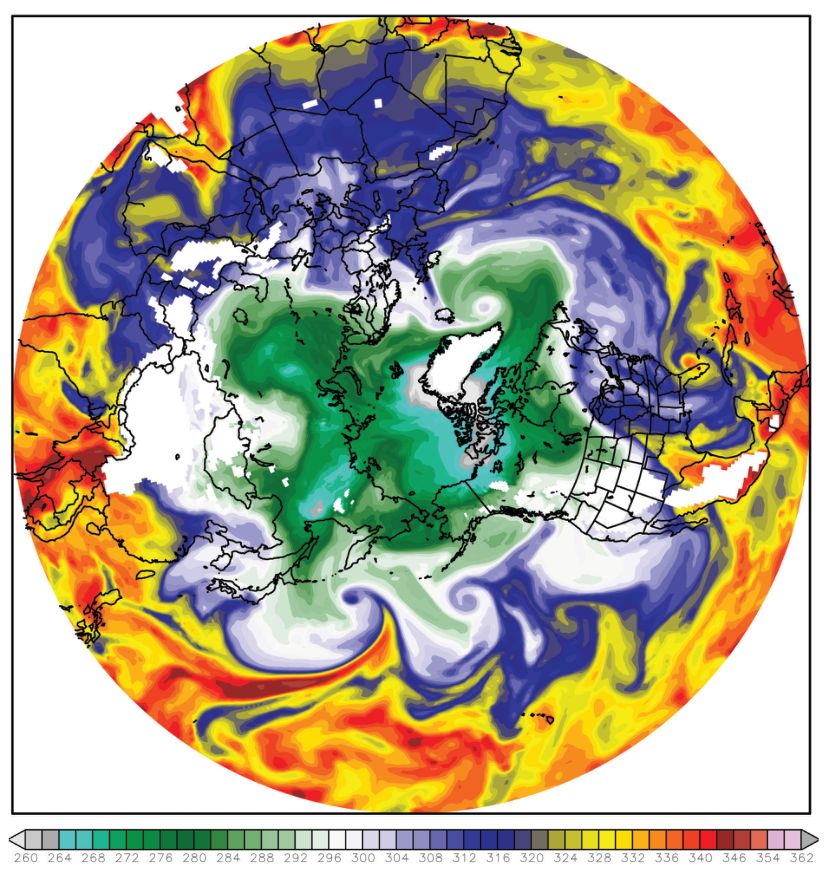
Whether a coincidence or not, at the same time as Forrest completed ET and explosively deepened, a purely baroclinic system explosively deepened in the North Atlantic and reached its minimum sea-level pressure of under 925 hPa at the same synoptic time as Forrest: 00Z October 30, 1989. The polar stereographic view (Figure 2.17) of the 850 hPa thetaE shows the cyclonic warm anomalies of the mature warm seclusions: Forrest and the North Atlantic development near Iceland. The number of cyclones during the past three decades that reach a pressure of less than 930 hPa is small and clearly an extreme event. Further examination using local eddy kinetic energy diagnostics may extricate the large-scale signals responsible for the coincident extreme cyclones.
Figure 2.17: Polar stereographic view of 850-hPa level equivalent potential temperature (θE, shaded Kelvins) at 00Z on October 30, 1989. p. 41
Several other cases have been identified and are discussed later in this dissertation. An example that typifies the interactions between tropical cyclones and the midlatitude environment is typified by Super Typhoon Wipha of 2007 and its interaction with another decaying tropical cyclone and subsequent extratropiacal transition (Figure 2.18 a-e). On September 15, Typhoon Nari is located in the Sea of Japan and is encountering the vertical shear associated with the polar jet. The characteristic upper-level outflow downstream encircles a vast moat of dryness in the central North Pacific associated with the subsidence from rapidly developing Wipha located northeast of the Philippines. During the next 48 hours, an impressive warm seclusion forms from the remnants of Nari and a powerful upper-level PV anomaly from upstream (not shown). For September, the minimum sea-level pressure associated with the warm seclusion (Figure 2.18 d-e) was analyzed below 955 hPa, very intense and anomalous for a non-tropical system in the Northern Hemisphere.
Figure 2.18: MTSAT IR imagery (shaded, °C) showing the downstream development with Typhoons Wipha and Nari on September 16, 2007 at (a) 00Z (b) 06Z (c) 12Z (d) 18Z and September 17, 2007 at (e) 00Z (f) 06Z. p. 42
p. 24Mainly during September and October, Northern Hemisphere tropical cyclone activity often is coincident with explosive extratropical cyclone development in the same basin directly downstream. The preconditioning of the upper-level jet through the TC’s diabatic outflow likely enhances divergence aloft, which aids in the phase-locking of incipient low-level baroclinic waves to the upper-level energy source. Satellite signatures include a trailing cold-front directly connecting the extratropical cyclone and tropical cyclone in lower latitudes. Other notable Pacific examples include Tropical Storm Luke (1991), Typhoon Babb (1998), and Typhoon Gay (1981). The Atlantic basin as well as the Southern Hemisphere (SH) sees similar phenomena but much less often. Irene (1999), Lili (1996), Kate (2003), and Keith (1988) have been identified in the North Atlantic. One SH example involves intense (110 knots maximum one-minute sustained wind) Tropical Cyclone Felana from March 1990 in the South Indian Ocean which reintensified into a 949 hPa warm seclusion after ET. A recent explosive reintensification of Tropical Cyclone Ken (March 2009) saw the storm slowly trek across the Southern Pacific Ocean until redeveloping dramatically after encountering a vigorous negative upper-level PV anomaly (-PV in the SH).
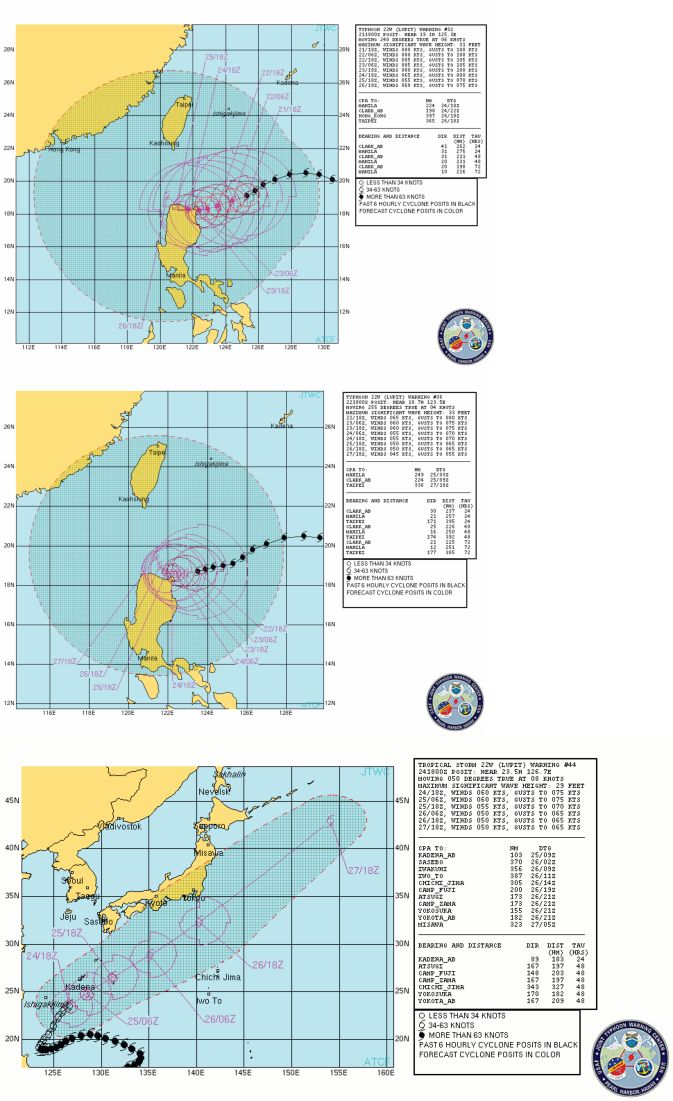
p. 84Lupit formed from an area of disorganized deep convection east of Guam on October 14, 2009 and slowly translated westward as it intensified, and briefly threatened the Philippines before recurving to the northeast toward the Kamchatka Peninsula. While no fatalities or damage was reported, Lupit is interesting due to the considerable NWP operational deterministic forecast difficulties prior to the recurvature and extratropical transition (ET). JTWC operational advisory positions issued on 21/18z (Figure 4.11a) for the following 120-hours indicated a slow, southwestward drift into Luzon for Lupit. A similar forecast scenario on 22/18z (Figure 4.11b) hinted at recurvature late in the 120-hour warning position. The forecast position 5-days later was still south of 20° N while the actual or verifying position was 45° N. As NWP guidance increased confidence in the recurvature and ET prognosis, the forecast markedly improved to closely match the actual track as shown at 24/18z (Figure 4.11c).
Figure 4.11 JTWC operational forecast warning/advisory maps for Typhoon Lupit (October 2009) at (a) 21/18z, (b) 22/18z, and (c) 24/18z. p. 100, 101
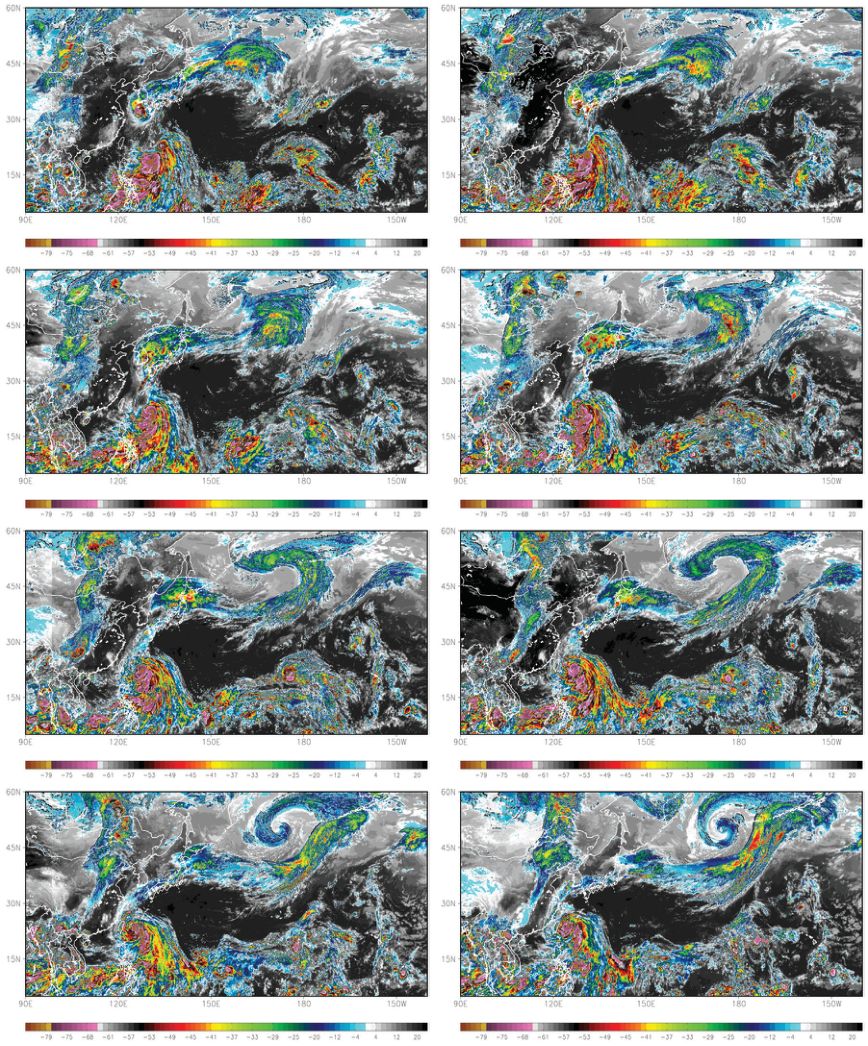
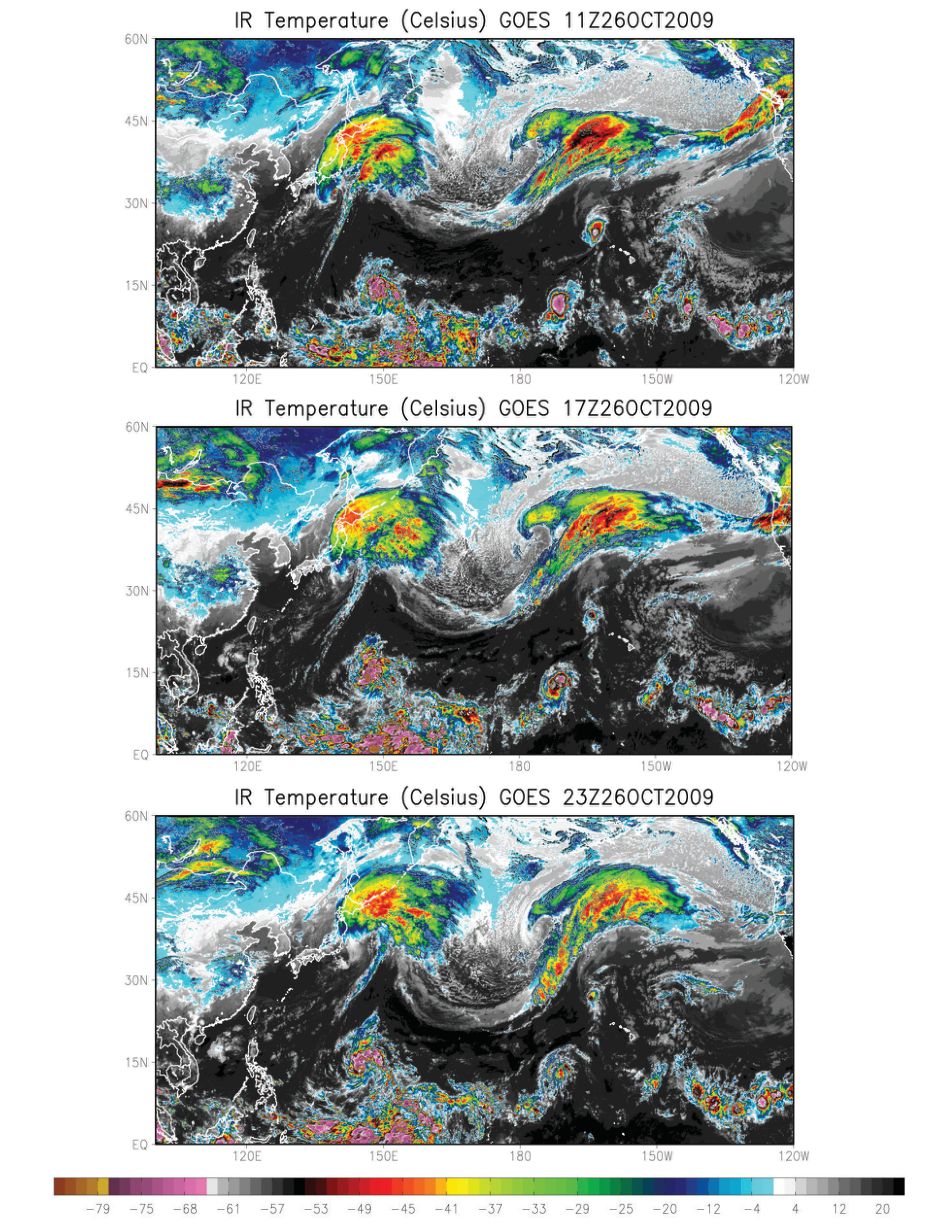
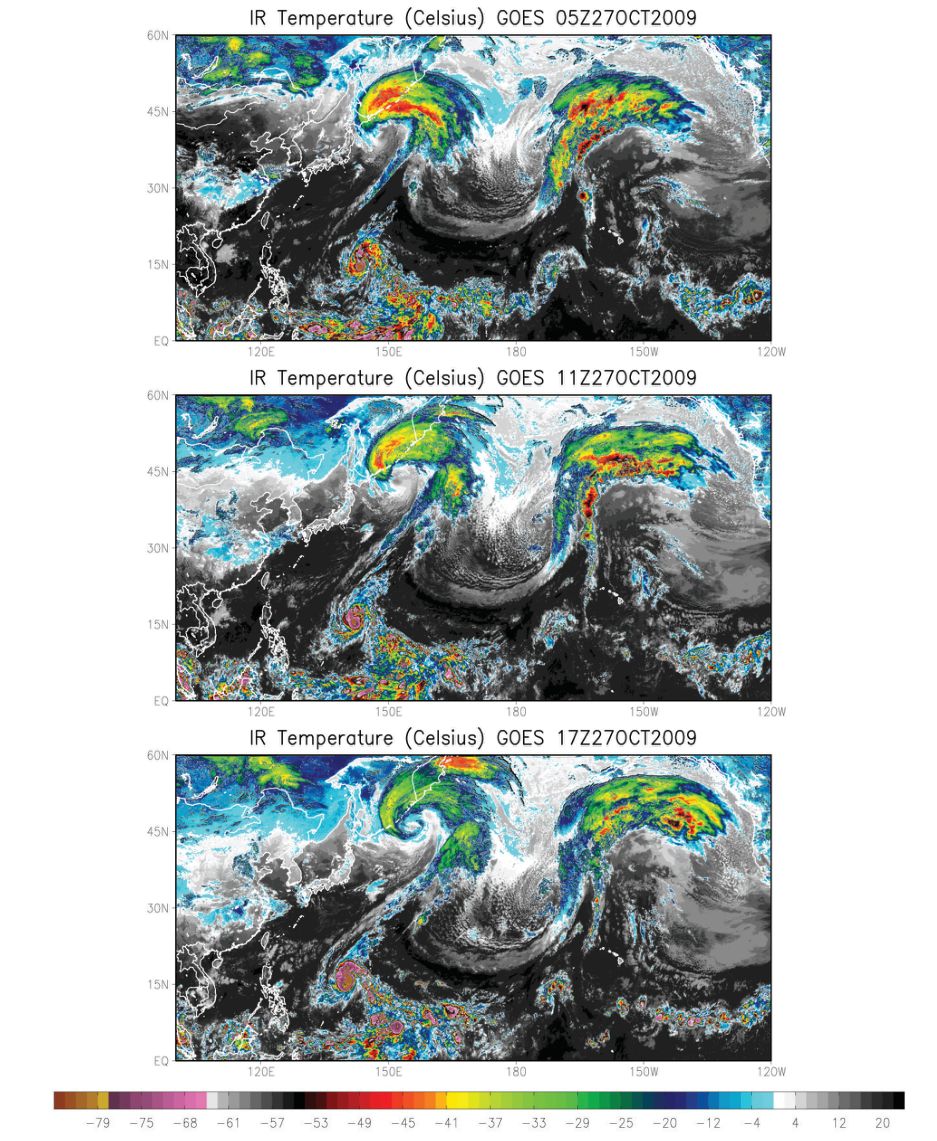
IR satellite imagery (Figure 4.12) highlights the impressive ET of Lupit and its deep convective cloud head spread over Japan. A very thin trailing cold front followed which is characteristic of a powerful LC2-type baroclinic development. As Lupit accelerated poleward of 45° N, a deep anticyclonic wave-breaking episode occurred immediately downstream. On October 27, at the tail end of ex-Lupit’s weak trailing front, Typhoon Mirinae was slowly gaining strength on its westerly track.
Figure 4.12 Infrared satellite imagery for the extratropical transition of Lupit (2009) [shaded, °C] at (a) 26/11z, (b) 26/17z (c) 26/23z, (d) 27/05z, (e) 27/11z, and (f) 27/17z. Data from the GRISAT. p. 102, 103
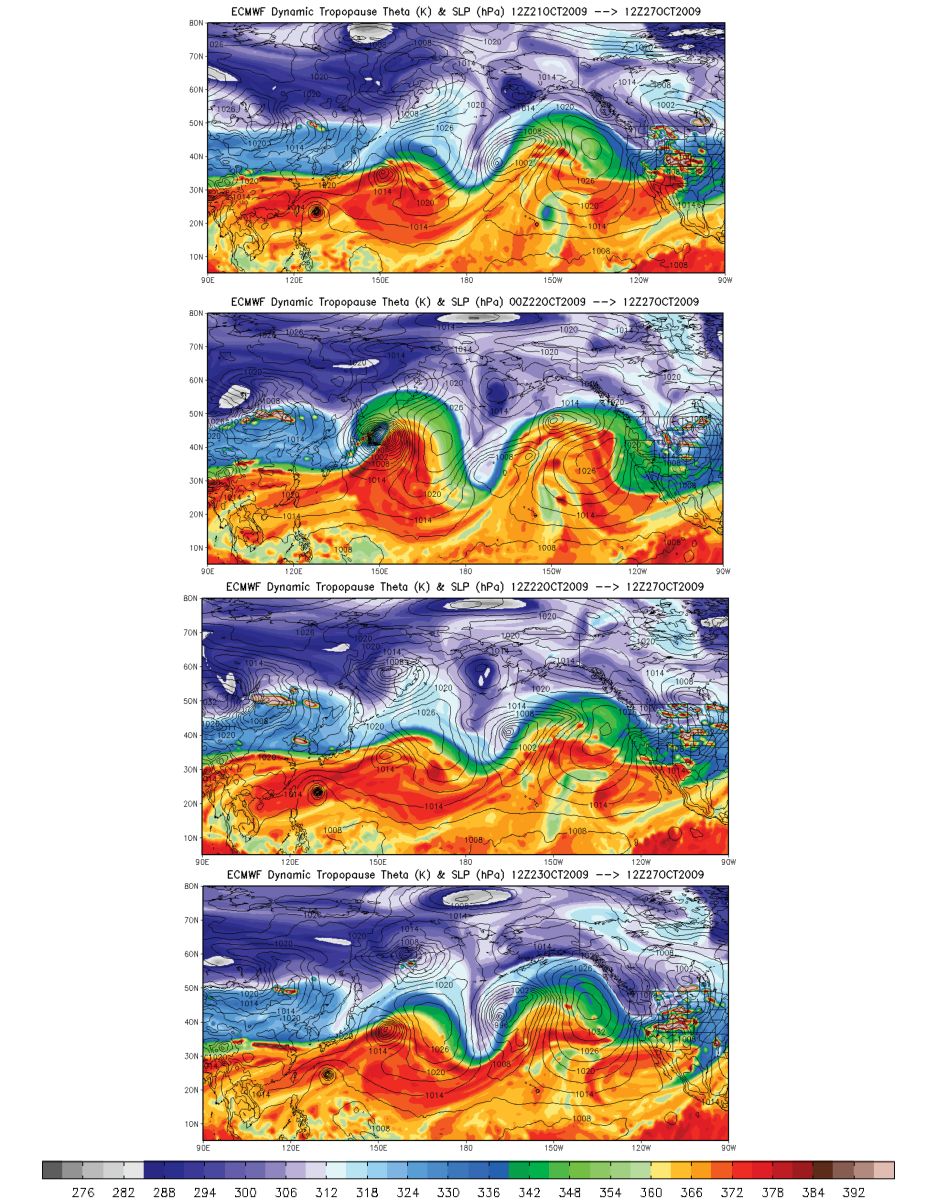
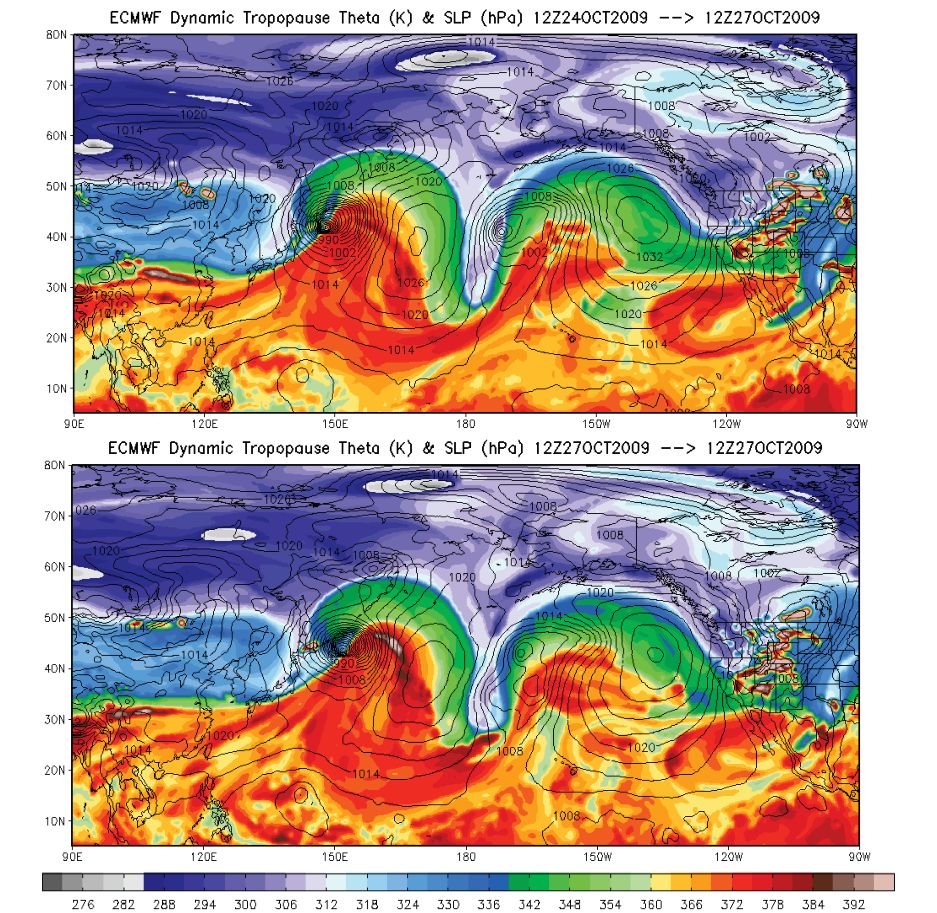
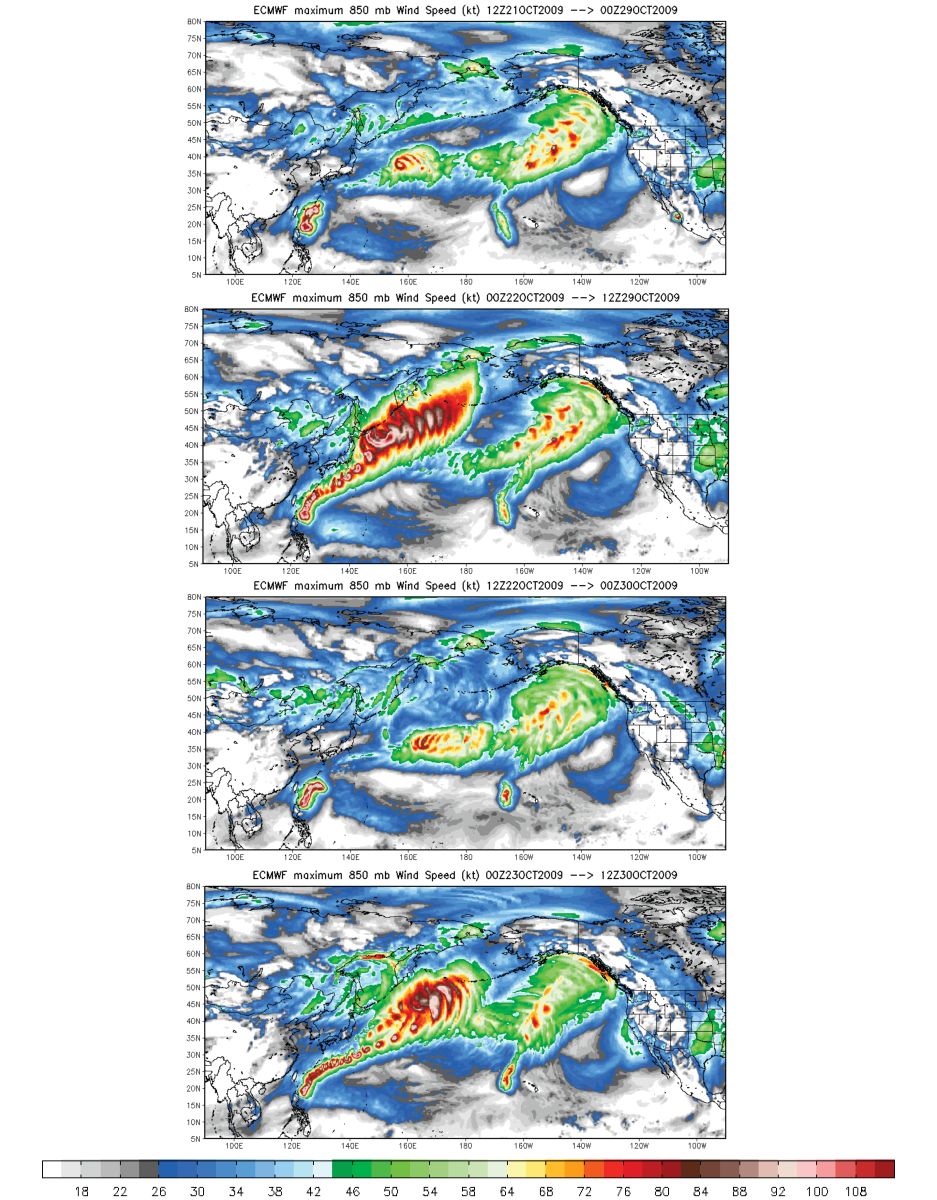
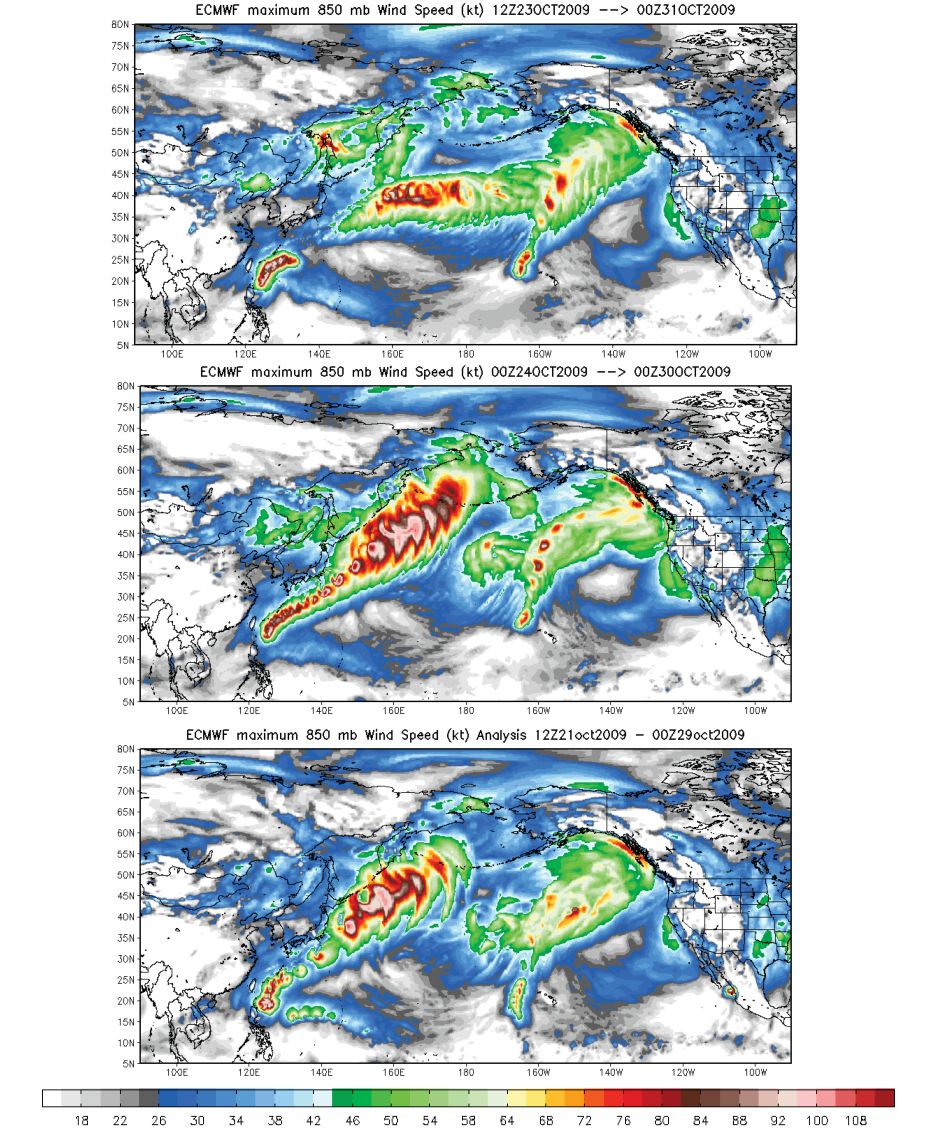
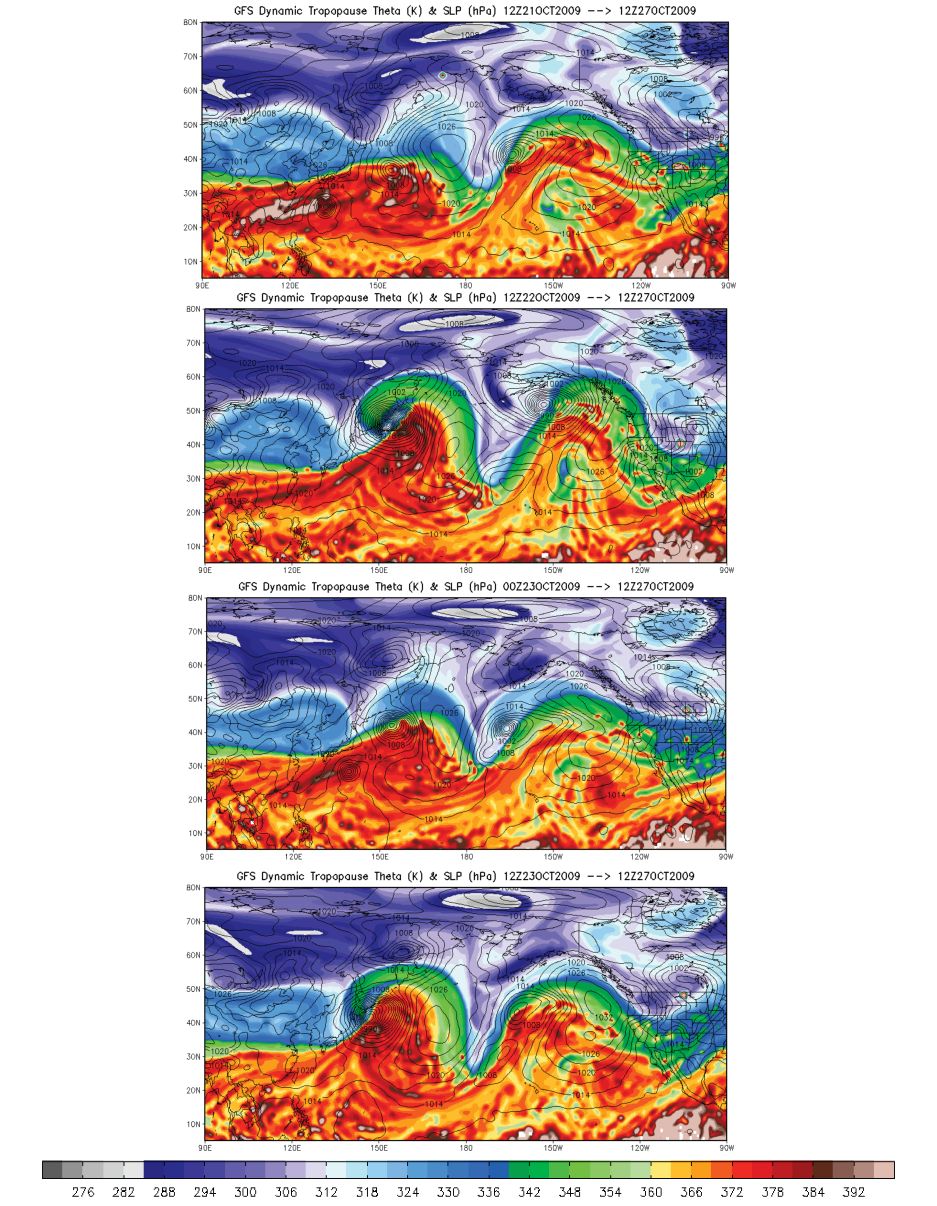
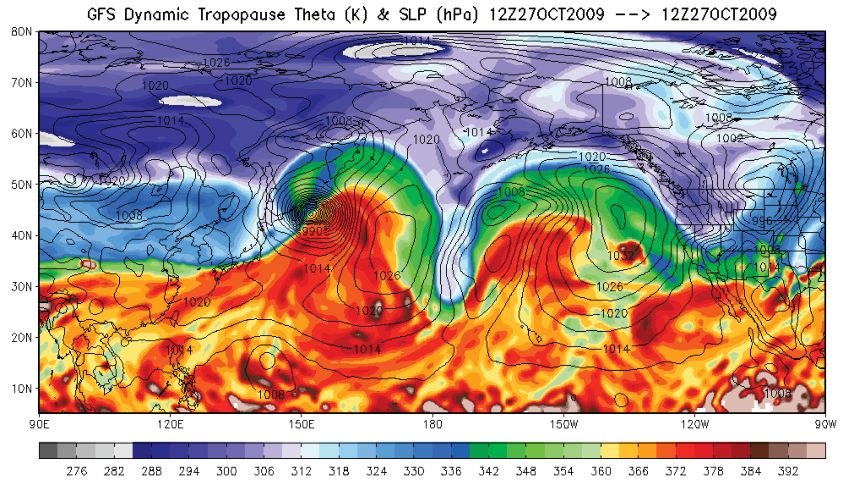
As discussed, forecasting TC recurvature is often difficult along with predicting the impacts upon the midlatitude circulation. The goal here is to visualized and diagnose the forecast uncertainty with a variety of metrics complimentary to the EKE diagnostics. First, a sequence of dynamical tropopause (DT, 2 PVU surface) potential temperature forecast maps from the ECMWF deterministic model demonstrates cycle-to-cycle uncertainty in the evolution of Lupit (Figure 4.13). Each forecast verifies at 27/12z (analysis Figure 4.13f) and the DT analysis with MSLP contours clearly shows a powerful extratropically transitioned TC at 45° N (955 hPa central pressure) and equatorward wavebreaking just east of 180° E. Companion 850 hPa wind speed maximum swath maps are generated for 180-hours forecasts (Figure 4.14).
4.13 ECMWF operational deterministic forecasts of dynamical tropopause [DT – 2 PVU surface] potential temperature [shaded K] and MSLP [black contours each 2 hPa] verifying at 10/27 12z with initial forecasts at (a) 10/21 12z, (b) 10/22 00z, (c) 10/22 12z, (d) 10/23 12z, and (e) 10/24 12z, and corresponding analysis at (f) 10/27 12z. p. 104, 105Figure 4.14 Typhoon Lupit (October 2009) ECMWF deterministic 850 hPa wind speed swaths [shaded, knots] for 180 hour forecasts initialized at (a) 21/12z (b) 22/00z (c) 22/12z (d) 23/00z (e) 23/12z and (f) 24/00z. p. 106, 107
ECMWF forecasts at 21/12z, 22/12z, and 23/12z do not indicate recurvature of Lupit while the cycles at 22/00z, 23/00z (not shown), and 24/12z closely match the analysis at 27/12z (verifying time). In the cases without ET/recurvature, the typhoon remains near 20°-25° N and two weak downstream extratropical cyclones are in the midlatitudes. With the failed forecasts, Mirinae was not developed.
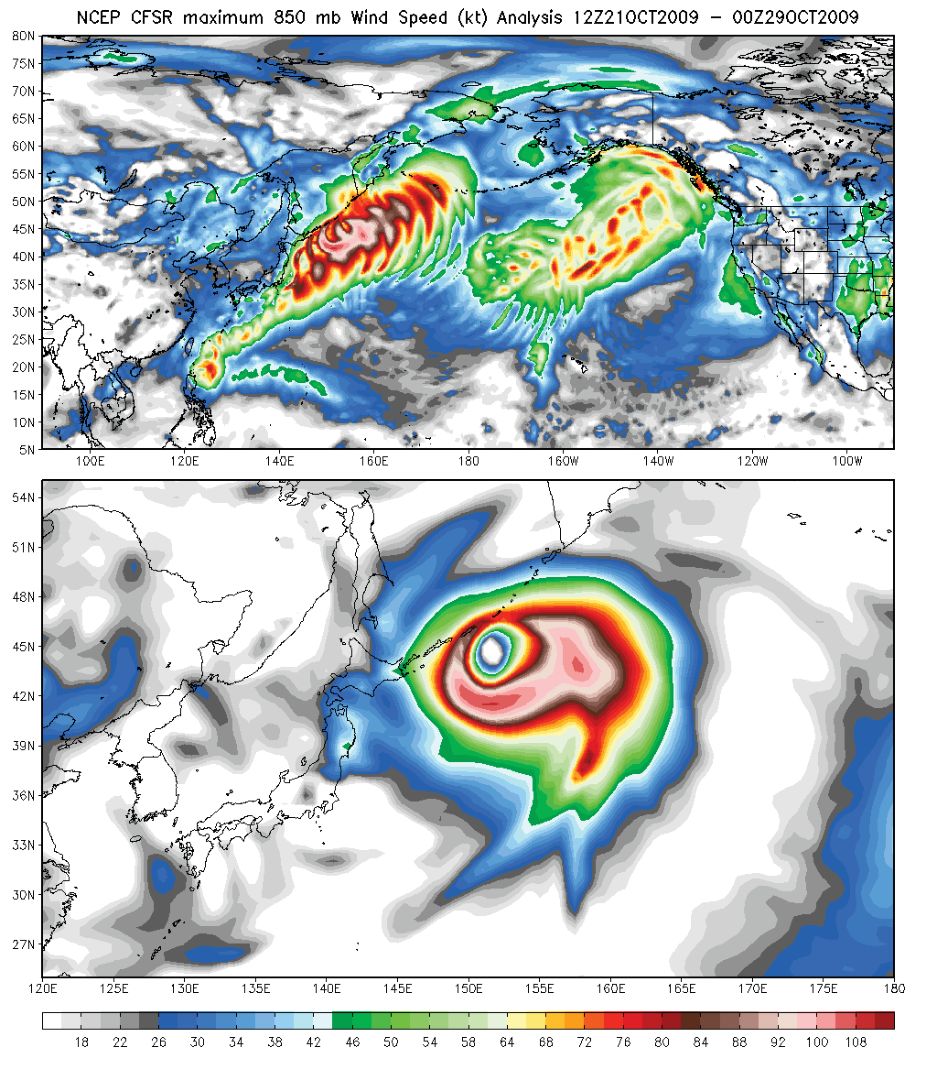
The GFS forecast DT potential temperature maps (Figure 4.15) similarly show uncertainty associated with the ET of Lupit. Interestingly, the incorrect 21/12z and 23/00z GFS forecast scenarios match the synoptic situations in the ECMWF 21/12z and 23/12z cycles. The corresponding NCEP CFSR 850 hPa wind speed swath (Figure 4.16a) and snapshot at 27/12z (Figure 4.16b) show maximum winds exceeding 110 knots while in a mature warm seclusion state.
Figure 4.15 same as 4.13 except for NCEP GFS deterministic model verifying at 27/12z for forecasts initialized at (a) 21/12z (b) 22/12z (c) 23/00z (d) 23/12z and the corresponding analysis at (e) 27/12z. p. 108Figure 4.16 NCEP CFSR 850 hPa reanalysis wind speed (a) swath [shaded, knots] for period 10/21 12z – 10/29 00z 2009 and (b) snapshot at 10/27 12z for extratropical transition of Lupit with reanalyzed MSLP of 954.6 hPa. p. 109
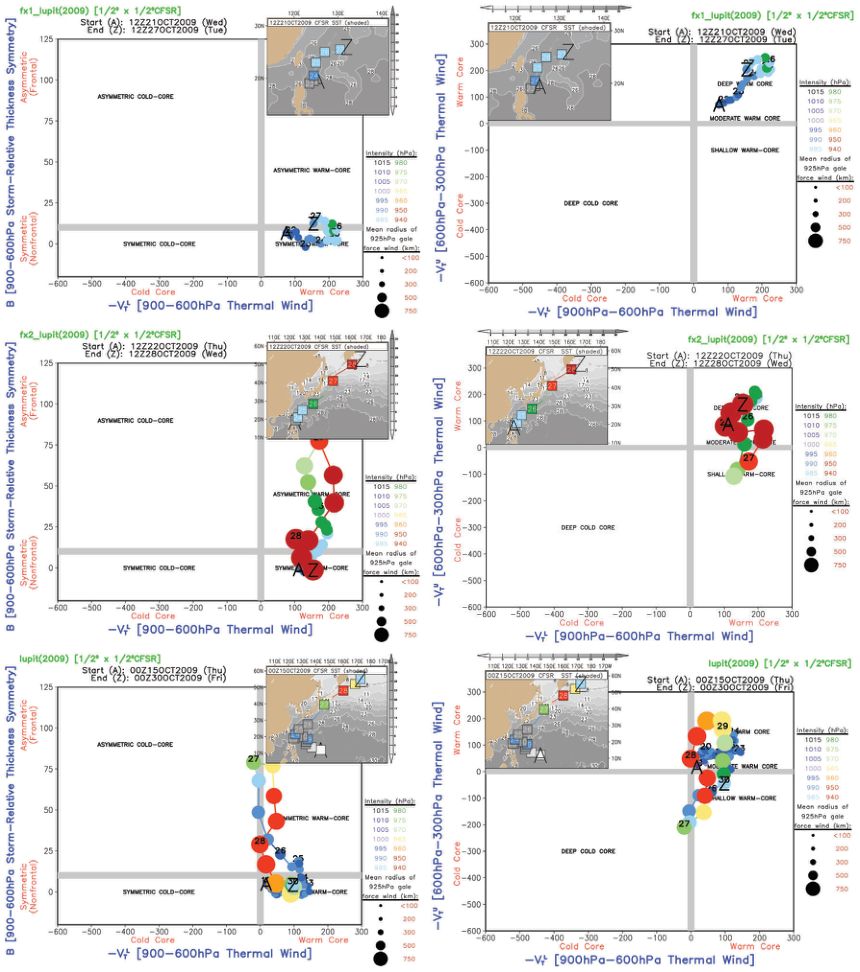
p. 85For reference, the cyclone phase space diagrams (Hart 2003) for two differing GFS scenarios on 21/12z and 22/12z show the very significant lifecycle evolution disparity (Figure 4.17 a,b). The CFSR track of Lupit is show in Figure 4.17c as the analysis positions and thermal / frontal structure. While the track is closer to reality in the 22/12z cycle, the intensity at maturity is 938 hPa, about 15 hPa lower than the analysis at maximum intensity (lowest MSLP).
Figure 4.17 Lupit (2009) cyclone phase space diagrams (Hart 2003) for NCEP GFS forecasts of 144-hours initialized at (a) 10/21 12z and (b) 10/22 12z with the corresponding NCEP CFSR reanalysis from 10/15 00z to 10/30 00z. p. 110
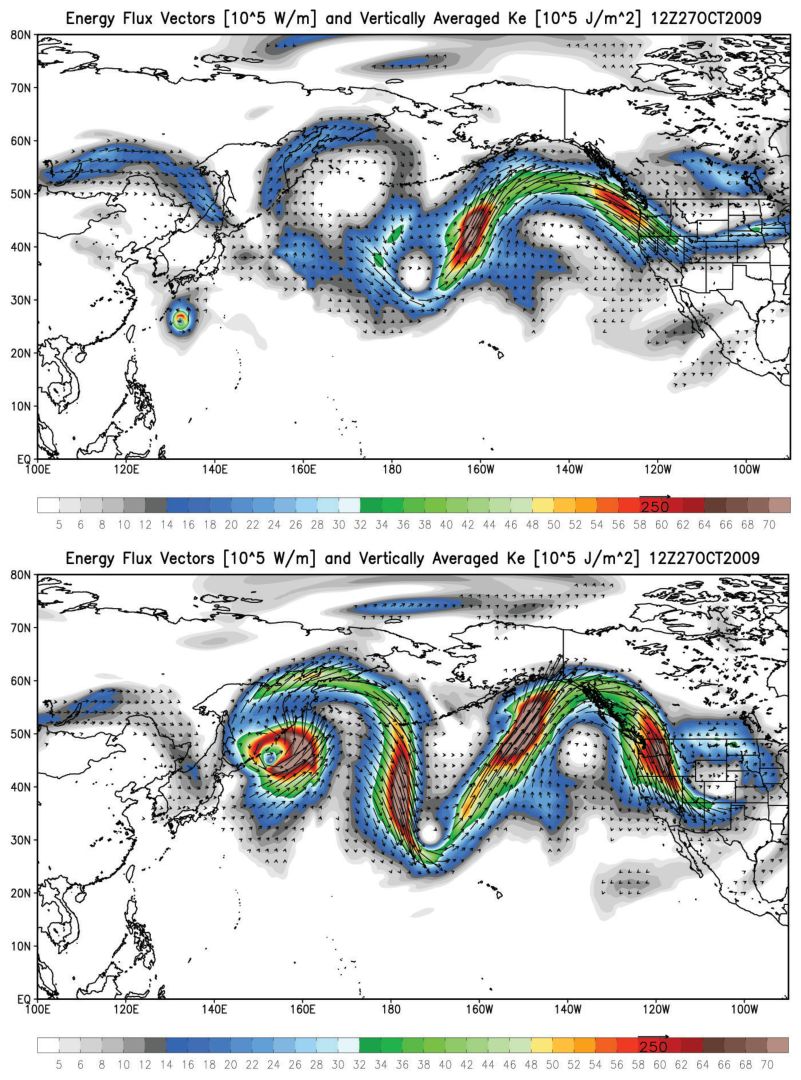
Using conventional diagnostics as shown in §4.3.1 are helpful for case-to-case synoptic-dynamic understanding of the forecast uncertainty, EKE diagnostics are also useful in showing the dominant energy fluxes associated with Lupit. Energy flux vectors are superposed upon vertically averaged Ke for two NCEP GFS deterministic forecasts at 21/12z (Figure 4.18a) and 22/12z (Figure 4.18b) verifying at 27/12z. The NCEP CFSR is used for the background 28-day mean circulation or background state. As the overall Ke is significantly reduced in the non-ET scenario [21/12z forecast], it is striking the magnitude of the Ke in the ET case and the high amplitude of the upper-level waveguide associated with the wavebreaking and downstream ridge growth.
Figure 4.18 NCEP GFS (October 2009) deterministic forecasts of energy flux vectors (reference vector 105 Wm-1) and vertically averaged Ke [105 Jm-2] for (a) 144 hour forecast initialized at 21/12z verifying at 27/12z and (b) 120-hour forecast initialized at 22/12z verifying at 27/12z. p. 111
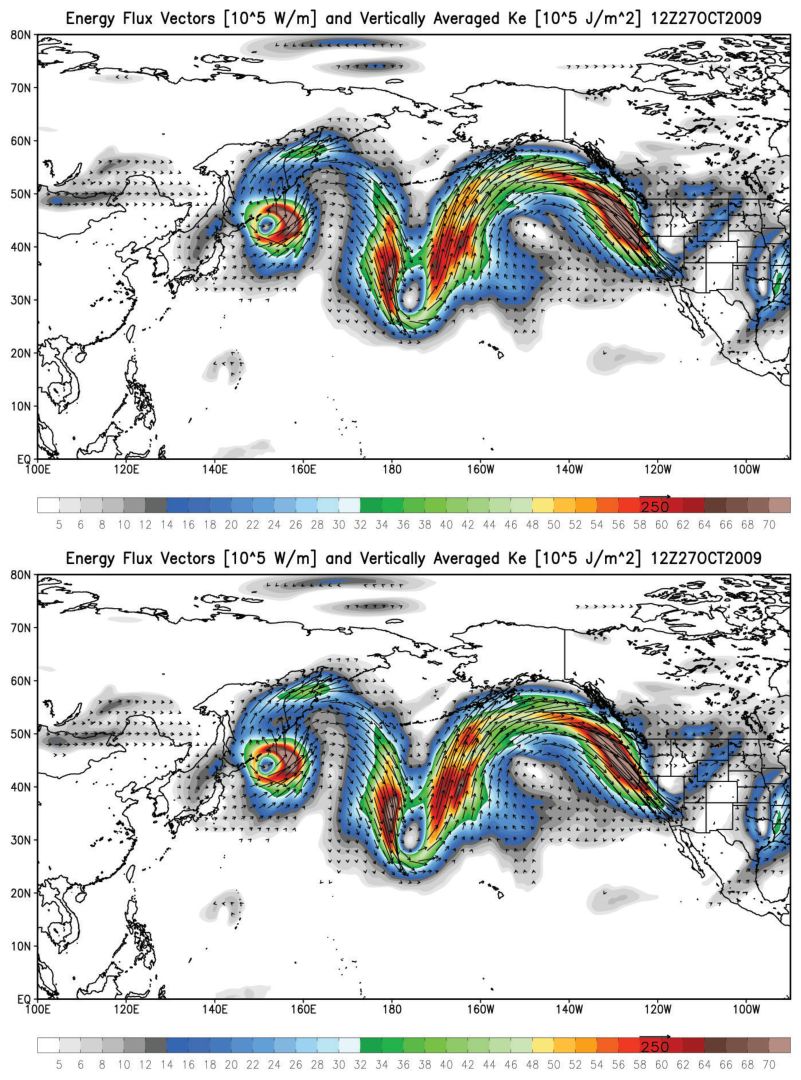
Questions to be addressed include the source of the forecast error in each operational deterministic model, the dynamics associated with this particular case of extratropical transition, and the downstream midlatitude impacts. The new CFSR product closely matches the GFS deterministic analysis at 27/12z (Figure 4.19) and is a useful tool for analyzing energy flux using a frozen model during the past 30-years, which may be helpful in diagnosing particular model deficiencies. Mesoscale model simulations using WRF and the CFSR boundary and initial conditions and PV inversion or surgery techniques may elucidate upon the role of Lupit or the environment in the recurvature event. Furthermore, as the case is relatively recent, Navy NOGAPS adjoint sensitivity and observational impact studies may yield insightful conclusions.
Figure 4.19 Same as Figure 4.18 but analysis comparison at 10/27 12z between NCEP (a) CFSR reanalysis product and (b) GFS deterministic model analysis. p. 112
#4.2.3 Large scale environmental thermal structure
From the cyclone phase space climatology in Chapter 3, it was demonstrated that warm seclusions are thermally warm core at least at lower-levels and possibly at upper-levels depending upon the height of the tropopause. However, with the prevalence of tropopause folds and other cyclone structure, the single vertical profile extending 500-km from the cyclone’s MSLP minimum does not directly provide information about the large scale environment within which the storm is embedded. Instead of focusing on the storm center’s profile, thermal profile parameters are calculated at each grid point out to a 500-km radius and assembled into maps with other atmospheric diagnostics.
Continuing with the case of the ET of Lupit (October 2009), the upper-level thermal phase profiles [-VTU] are calculated for 21/12z and 27/12z (Figure 4.20) from the CFSR. 250 hPa wind speed contours are superposed for referencing the upper-level jet. While TCs are not particularly well resolved in reanalysis products (c.f. Chapter 7; Maue and Hart 2007), Lupit’s upper-level warm core is strong within the tropical environment south of the confluent upper level jet at 21/12z. The jet is characterized by winds exceeding 70 ms-1 in the core off of Japan. –VTU values of -400 to -500 are characteristic of very favorable cold-core or baroclinic environments.
Figure 4.20 NCEP CFSR (October 2009) large-scale environmental upper-level [600-300 hPa] cyclone phase space parameter [shaded –VTU scaled x 10] and 250 hPa wind speed [black contours, every 10 ms-1] at (a) 10/21 12z and (b) 10/27 12z. p. 113
p. 86After ET at 27/12z, the entire midlatitude circulation has changed from a zonal straight-oriented jet to a high amplitude pattern with intense equatorward wavebreaking. Ex-Lupit’s warm core aloft is indeed a reflection in the 600-300 hPa calculation of the descending tropopause fold. Surrounded on the flanks, a baroclinic environment associated with the poleward extension of the jet envelops the upper-level warm core and the warm sector, which has a much higher tropopause. The –VTU parameter is intensely cold-core along the downstream jet which has intensified to near 100 ms-1 all the way to the Pacific coast of North America. It is clear that the ET of Lupit contributed greatly to the entire eastern North Pacific becoming strongly baroclinic at upper-levels.
This tool is also helpful in diagnosing overall upper-level thermal structure in forecast situations. Going back to the GFS forecasts of Lupit, the environmental thermal structure of the non-ET cycle [21/12z] is markedly different than the ET cycle [22/12z] (Figure 4.21). Indeed while both forecasts demonstrate downstream baroclinic structure with a strong jet, the phase or amplitude is significantly different. In the first cycle, the symmetric warm core of Lupit does not suggest significant direct interaction with the midlatitude jet.
Figure 4.21 same as 4.20 except for NCEP GFS operational forecast verifying at 10/27 12z for initialization at (a) 10/21 12z and (b) 10/22 12z. p. 114
From a climatological point of view, two additional cases are shown including Typhoon Forrest (October 1989) and a strong February 2008 North Pacific warm seclusion. Demonstrating that very rapid thermal structure changes associated with ET and warm seclusion development, Forrest dramatically increases the scale and strength of its upper-level warm core in a 6-hour span from 29/18z to 30/00z due to extreme tropopause folding which is necessarily related to stratospheric dry and stable air (Figure 4.22 a,b). Even though in late October similar to Lupit (2009), the North Pacific midlatitude circulation is not as vigorously cold-core or baroclinic due to the lack of a powerful downstream jet. The North Pacific February 2008 warm seclusion at 12/18z (Figure 4.22c) shows an intense example of a zonal jet extending across the dateline. Future research will focus upon the upper-level thermal structure, the relationship with the upper-level jet, and tropopause potential vorticity anomalies.
Figure 4.22 same as 4.20 for NCEP CFSR representing the ET of Typhoon Forrest (1989) at (a) 10/29 18z and (b) 10/30 00z and extratropical cyclone of 2008 at (c) 02/12 18z. p. 115
The environmental thermal profiles can also be calculated in the lower troposphere from 900-600 hPa representing the –VTL cyclone phase space parameter (Hart 2003). A sequence of environmental –VTL for the Feb 2008 storm as introduced previously is included with MSLP contours (Figure 4.23). At 10/00z, a preceding warm seclusion is northeast and downstream of a developing baroclinic zone and incipient wave centered at 25° N, 140° E. Behind the mature cyclone, where secondary cyclogenesis is generally favored, the lower troposphere is strongly cold-core and baroclinic. It is in this area that the rapidly intensifying incipient wave moves and reaches 974 hPa at 11/12z. Finally, at maturity (940 hPa), the warm seclusion has a poleward flank and central core of strongly warm core thermal structure (12/00z, Figure 4.10c). A similar lower-level baroclinic zone trails the warm seclusion behind its cold front for the next incipient wave in the sequence.
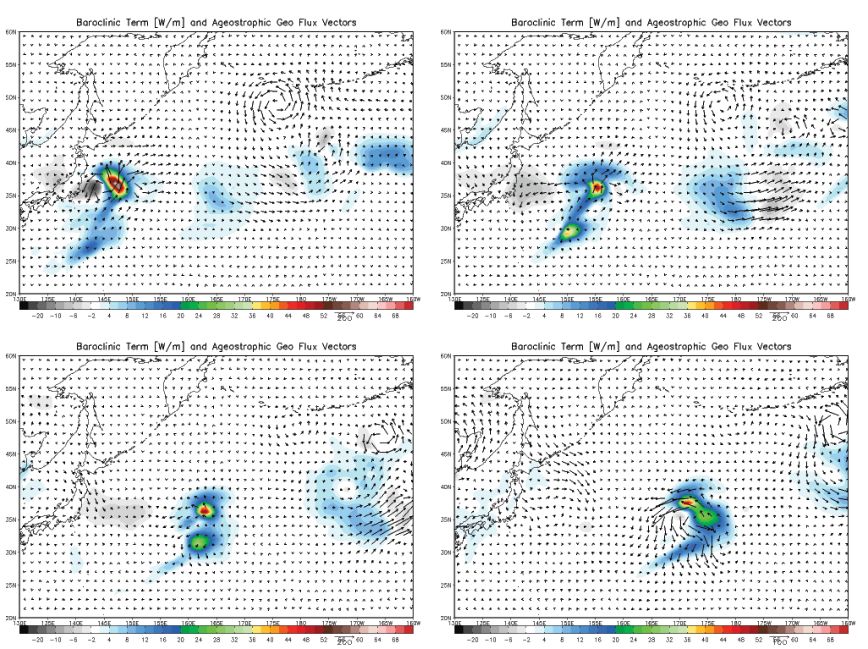
Figure 4.23 NCEP CFSR large-scale environmental lower-level cyclone phase parameter [900- 600 hPa] [shaded –VTL x 10] and MSLP [black contour, every 2 hPa] at (a) 02/10 00z (b) 02/11 12z and (c) 02/12 00z. p. 116Figure 4.10 Vertically averaged Ke generation resulting from baroclinic conversion (contours; W m−1) and ageostrophic geopotential flux vectors (reference vector; 105 W m−1) for February 2008 storm at (a) 10/00z (b) 10/12z (c) 11/00z and (d) 11/12z. p. 99
p. 193Since 1995, the North Atlantic basin has experienced considerably enhanced hurricane activity in terms of frequency, intensity, and duration (Goldenberg et al. 2001; Emanuel 2005). On the heels of the exceptionally active 2004 and 2005 NATL hurricane seasons and Hurricane Katrina in August 2005, two high-profile studies appeared in the prestigious Science and Nature journals discussing the impacts of increasing sea-surface temperature (SST) on tropical cyclone (TC) frequency and intensity during the past 30-40 years. Webster et al. (2005) and Emanuel (2005) both utilized the best-track datasets from the National Hurricane Center (NHC) and Joint Typhoon Warning Center (JTWC) and various SST datasets to describe the apparent increase in intense TCs (Category 4 and 5) and TC power in the past 30-years. Immediately after, a series of papers (e.g. Landsea et al. 2005) questioned the validity of the best-track intensity measurements for long-term climate studies finding that many TCs may not have been accurately estimated using the methods at the time. In the following few years, a vibrant and vigorous debate continued on about the quality of global best-track data, the connections with global warming and climate change, as well as interpretations of climate modeling output in terms of intensity and frequency changes in a warming world.
A recent review article by Knutson et al. (2010) in the new Nature Geosciences journal brought together several researchers who had held diverging views in order to build a consensus report on tropical cyclones and climate change. The goal was also to update the statements in the Intergovernmental Panel on Climate Change (IPCC) fourth assessment report (AR4, Solomon et al. 2007). As with the recent record global TC inactivity (Maue 2009), considerable interannual variability in frequency and intensity make trend attribution studies very difficult with our current datasets. Knutson et al. highlighted this uncertainty in attributing past changes in TC to anthropogenic causes since the natural variability is so large. Since the best-track datasets are primarily a result of real-time operational intensity and position estimates, their accuracy and completeness have varied considerably during the past century. With the launch of geostationary satellite coverage in the 1970s, much global monitoring of tropical cyclones is accomplished through Dvorak satellite methods (Velden et al. 2006). At times in the past, aircraft reconnaissance missions have sampled TC structure and directly measured intensities, but not until 2007 with the advent of the Stepped Frequency Microwave Radiometer have comprehensive surface wind observations been of high quality (Rappaport et al. 2009).
The IPCC AR4 concluded: "It is more likely than not that anthropogenic influence has contributed to increases in the frequency of the most intense tropical cyclones (Solomon et al. 2007)." However, Knutson et al. did not draw such a conclusion and summarized: "Specifically we do not conclude that there has been a detectable change in tropical cyclone metrics relative to expected variability from natural causes, particularly owing to concerns about limitations of available observations and limited understanding of the possible role of natural climate variability in producing low frequency changes in the tropical cyclone metrics examined." Knutson et al. conclude that it is "more likely than not that global tropical storm frequency will decrease and more likely than not that the frequency will decrease and more likely than not that the frequency of the more intense storms will increase in some basins." Another recent assessment report under the auspices of the United States Climate Change Science Program (Karl et al. 2008) concluded that it is "very likely that human induced increase in greenhouse gases has contributed to the increase in sea surface temperatures in the hurricane formation regions", and the "Power Dissipation Index in the North Atlantic is substantial since 1970, and is likely substantial since the 1950s and 60s, in association with warming Atlantic sea surface temperatures," and that "it is likely that the annual numbers of tropical storms, hurricanes and major hurricanes in the North Atlantic have increased over the past 100 years, a time in which Atlantic sea surface temperatures also increased." Knutson et al. did "not assign a "likely" confidence level to the reported increases in annual numbers of tropical storms, hurricanes and major hurricanes counts over the past 100 years in the North Atlantic" nor did they find that the Atlantic Power Dissipation Index increase since the 1950s is likely substantial.
p. 194This chapter contains research that was conducted prior to the new assessment or consensus described in Knutson et al. (2010) but the conclusions throughout are qualitatively the same. Indeed, using well-accepted metrics of TC activity, it will be shown that there is considerable interannual variability and large amplitude changes in intensity, frequency, and duration of storms. Accepting the best-track data records as is, we make no attempt to correct for heterogeneities. We do however discuss problems in using current and past atmospheric datasets in trend attribution studies. One advantage of integrated metrics over frequency or counts is that errors in TC intensity estimates are likely randomly distributed yet considerable reanalysis of the best-track records must be done. It is a goal to introduce and expound upon the two-pronged problem of understanding a TC's role in climate and how the large-scale climate modulates TC activity on weekly to monthly time scales and longer. Several published manuscripts have resulted from this work.
Two analogous metrics have been utilized in the literature to describe the increase in TC accumulated cyclone energy (ACE; Equation 7.1) and power dissipation (PD; Equation 7.2) which combine or convolve the intensity, frequency, and duration of season TC observations. ACE first appeared in the State of the Climate report for 1999 (Bell et al. 2000) and integrates the square of the one-minute maximum wind speed for each 6-hourly tropical storm observation while the PD index (PDI; Equation 7.3) utilizes the cube of the wind speed. Emanuel (2005) estimated the overall PD which includes information of the TC wind field or size by simply using the cube of the wind speed (instead of square as with ACE) and defined this estimate as the power dissipation index (PDI). In the North Atlantic, Emanuel (2005) showed that the PDI doubled during the past 30-years using TC best-track records.
The ACE and PDI metrics are convolutions of TC frequency, intensity, and duration as reported in the historical record. For a meaningful analysis of past TC activity, the three parameters must be accurately measured and reported in the historical best-track analysis of past storms. Especially prior to the initiation of global satellite coverage of the world’s oceans, aspects of the TC climatology have likely been misreported, including missing storms and poor intensity estimates (Landsea et al. 2006). Nevertheless, even with the data issues associated with the TC database, the integration of a season’s worth of lifecycles in the PDI or ACE calculation necessarily means that the duration component must dominate (Maue and Hart 2007).
7.1
7.2
7.3
p. 195The integral of the power dissipation (PD) is dominated by the duration component (Maue and Hart 2007) especially over a season or year in which hundreds of cyclone positions are accumulated. Yet as demonstrated in several basins including the North Atlantic (NATL, Kossin and Vimont 2007) and the Western North Pacific (WPAC, Camargo and Sobel 2005), there may be meaningful and significant relationships or correlations between intensity and duration due to the genesis location and track (Kossin and Camargo 2009). The former study noted the prevalence of long-lived, intense Cape Verde hurricanes in the NATL during periods when the Atlantic Meridional Mode (AMM) persisted in a strongly positive phase during the summer months. The latter study, among others, showed that intense, long-track typhoons developed closer to the International Dateline during El Niño summers, which similarly allowed for very-high PDI or ACE per storm as in the positive AMM situation in the NATL. In the past decade, research has attempted to hone in on the climate mechanism(s) responsible for this step increase in NATL hurricane activity since 1995. Goldenberg et al. (2001) published a highly visible Science article that posited the role of the Atlantic Multidecadal Oscillation (AMO) in describing the cyclical nature of active hurricane periods and decadal SST evolution in the basin. Conversely, a series of high-profile studies have suggested that the upward trend in tropical sea surface temperatures (SSTs) is caused by global warming and is directly related with the increase in NATL TC activity.
In 2007 and 2008, several studies injected additional uncertainty into the body of TC and climate change research, which can be broadly categorized as either modeling or observationally based. In the latter category, Kossin et al. (2007) utilized 25 years of geostationary satellite data to objectively re-analyze the world’s TCs in an effort to bypass the historical best track datasets, which have been shown to be of increasingly questionable quality especially when reconnaissance flights are absent. The results confirmed the upward trend in NATL hurricane frequency and intensity as shown in the observational studies of Webster et al. (2005) and Emanuel (2005) but failed to show similar increases in other basins. Thus, the paper was heralded by many as a dissenting contribution to the human-caused global warming research. Proponents of a linkage attacked the methodology of Kossin et al. (2007) which was based upon Empirical Orthogonal Function (EOF) training of the objective Dvorak technique. However, in September 2008, a new study (Elsner et al. 2008) used a variant of the objective geostationary cyclone database in which they only examined the maximum intensity during the cyclone lifecycle. Quantile regression procedures were applied to the resulting time series and also correlated with increasing SST. The main conclusion was that the strongest of Indian Ocean and North Atlantic storms are indeed getting stronger due to global warming; however several assumptions are made which may not lead to such general conclusions. Briefly in the modeling category, the large-scale climate simulation scenario efforts of Knutson et al. (2008) and Emanuel et al. (2008) BAMS reported results that did not agree with the drastic increases extrapolated from the observational studies.
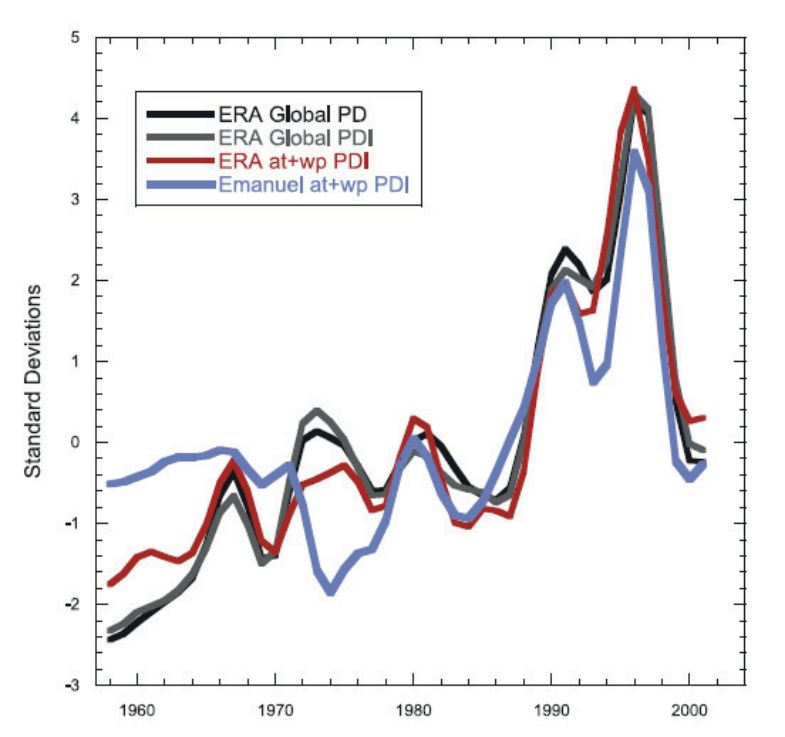
p. 196To date, the power dissipation index (PDI) metric has not been independently validated nor confirmed as an accurate estimation of the entire two-dimensional wind-field calculated power dissipation (PD, Emanuel 2005). The difficultly with this validation procedure is due to the availability of accurate and high-spatial resolution surface wind fields in strong TCs. First, Sriver and Huber (2006) attempted to use coarse reanalysis data surface winds, specifically the European Centre for Medium-Range Weather Forecasting 40-year Reanalysis (ERA40) with 1.125° grid spacing, to generate a long time-series of yearly PD for the globe and individual basins. This time series was also very closely correlated with NCEP-NCAR Reanalysis (NNR; 2.5° grid spacing) as well as various SST datasets (Figure 7.1). The authors reported robust and remarkable correlations buttressed by support from Dr. Kerry Emanuel in an unpublished Critique of “Can We Detect TCs” by Landsea et al. (2006) which appeared in Science on July 28, 2006. Emanuel writes:
Figure 7.1: From Sriver and Huber (2006), their Figure 1. Caption: “Power dissipation quantities for the ERA40 period 1958-2001, global PDI (gray curve), and PDI for the North Atlantic and Western North Pacific (red curve). The blue curve is the PDI derived from Emanuel (2005) best-track data. The curves were filtered and normalized with the respective standard deviations of the detrended time series.” p. 218
The second result overlooked by Landsea et al. is a paper by Sriver and Huber (2006), which uses re-analysis data to estimate TC power dissipation. Very little, if any, of the criticized “best track” TC data is used in the re-analysis technique, yet the results of this exercise, when normalized by the variance of the re-analyzed TC intensities, are very close to those reported by Emanuel (2005) based on an adjusted best-track data set. Although both the best-track data and the re-analysis TCs can be criticized on different grounds, it would be a startling coincidence if they yielded the same result by accident.
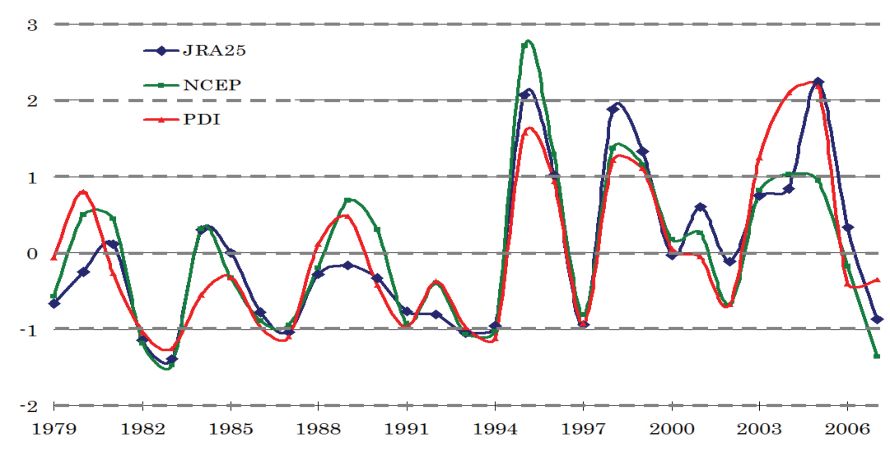
In a comment to Geophysical Research Letters, Maue and Hart (2007) pointed out that Sriver and Huber (2006) largely failed to examine the quality of the TC representation in the reanalysis data and the authors’ claims made in a press release issued by Purdue University were incorrect. Maue and Hart (2007) repeated their data analysis and found that several of their conclusions were overstated and indeed it was not a startling coincidence that the reanalysis data and best-track data derived PDI overlapped. As shown in Figure 7.2, normalized PD time series for each of two different reanalysis (JRA25, NNR) products nearly overlap during the satellite era (since 1979) with the best-track estimated PDI (red). In the response to the comment, Sriver and Huber (2007) simply compared the ERA40 and PDI time series correlations before and after the satellite era, and upon finding significant differences, suggested that the ERA40 data indeed provided accurate long-term estimations of power dissipation. This finding was supposed to prove that the ERA40 dataset indeed was able to adequately resolve TC mean-wind fields accurately during the two-separate pre- and post-satellite eras (~1979). However, as described in Maue and Hart (2007) and a poster presentation at the 1st International Conference on Hurricanes and Climate Change in Greece (May 2007), and in Manning and Hart (2007), TC representations (thermal and kinetic properties) within the then-current reanalysis products were woefullyinsufficient to deduce trends in area-averaged quantities on an individual cyclone or long-term, seasonal basis. It is the duration component of the non-independent time series that achieved the remarkable correlations between the reanalysis and best-track derived PD curves.
Figure 7.2: Normalized comparison of Reanalysis PD vs Best Track PDI from 1979-2007. The results from the ERA40 are quantitatively and qualitatively the same. The correlation between the respective reanalysis PD exceeds R =0.90. Similarly, the correlation between the BT PDI and Reanalysis PD exceeds 0.90. As shown in Maue and Hart (2007), an arbitrary constant wind (blue line, Figure 1) can be used instead of reanalysis data to arrive at the same conclusion (R>0.9) with increasing agreement after 1973. p. 219
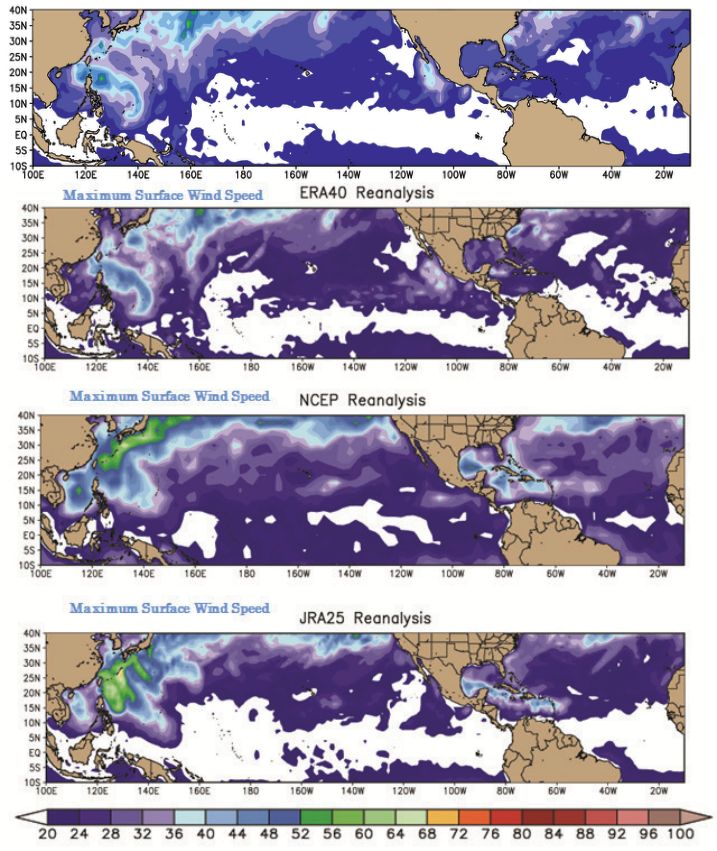
p. 197Figure 7.3 demonstrates that the maximum surface winds in three reanalysis products are insufficient to distinguish between the background and TC winds adequately and capture intensity information between secular Saffir-Simpson categories. It is more appropriate to use model levels higher in the troposphere at 900 or 850 hPa to capture more of the TC vorticity field and hence stronger winds. The maximum wind speed for each Saffir-Simpson category is reported in Table 1 for the reanalysis products for a 23 or 29 year period including the mean and standard deviation. This reanalysis-derived maximum wind speed quantity would be used to calculate the PDI or the wind speed cubed accumulated over a season’s worth of TC lifecycles. It is clear that the reanalysis products fail to adequately distinguish between Saffir-Simpson categories. The PD is calculated from a TC wind footprint or mean wind speed inside a given radius, here 350 kilometers. The Mean V also reported in Table 1 shows similar inability of the reanalysis products to adequately capture TC intensity characteristics. It is not reasonable to compare the pre- and post-satellite eras of TC reanalysis winds since neither period has been shown to resolve TC winds correctly. This is not unexpected and also has been shown by Bengtsson et al. (2007) who used a T159 climate model simulation similar to the resolution of the reanalysis products. Indeed, the resolution was insufficient to adequately model TC winds of hurricane intensities.
Figure 7.3: Maximum 10-meter surface wind speed (knots) for the period July 1 – October 31 2001 for ERA-Interim (top) ERA40 (top) and the year 2007 for JRA25 and NCEP Reanalysis (middle and bottom). p. 220
Table 7.1: North Atlantic satellite-era surface wind speed (m/s) for the ERA40 (1979-2001) and JRA25/NCEPR (1979-2007). Left is the mean and standard deviation of the maximum 10-meter surface wind speed (Max V ms-1) inside a 350 km radius circle for each Saffir-Simpson category as indicated by TC positions reported in the best-track dataset. Right is the mean and standard deviation average surface wind speed (Mean V ms-1) inside a 350 km radius circle. The latter is used within the TC footprint to generate the power dissipation metric.
Max V
NCEP
JRA25
ERA40
MeanV
NCEP
JRA25
ERA40
TS
13.3 ± 3.4
15.7 ± 3.4
15.3 ± 4.4
TS
8.0 ± 2.5
9.7 ± 2.7
9.1 ± 3.1
Cat 1
14.0 ± 3.4
19.0 ± 3.6
16.6 ± 4.4
Cat 1
9.1 ± 2.6
12.4 ± 3.1
10.3 ± 3.3
Cat 2
13.8 ± 3.4
21.1 ± 3.3
16.1 ± 4.6
Cat 2
9.0 ± 2.4
13.7 ± 2.5
10.2 ± 3.5
Cat 3
15.0 ± 3.6
22.4 ± 3.5
17.2 ± 4.3
Cat 3
10.0 ± 2.8
14.1 ± 2.7
11.1 ± 3.4
Cat 4
15.2 ± 4.0
22.9 ± 2.9
17.1 ± 4.0
Cat 4
10.0 ± 2.8
14.2 ± 2.7
11.0 ± 3.1
Cat 5
17.4 ± 3.8
23.6 ± 3.4
18.9 ± 3.5
Cat 5
11.4 ± 2.6
14.4 ± 2.7
12.4 ± 3.0
In summary, the TC power dissipation calculated from the ERA40 (1958-2001) does not independently confirm the power dissipation index trends published by Emanuel (2005), which only used the best-track maximum wind speed estimates. Furthermore, the reanalysis products used in Sriver and Huber (2006) do not provide a consistent, accurate, or robust representation of TCs, which has been demonstrated by Maue and Hart (2007) and Manning and Hart (2007). Recently, several new reanalysis datasets are in production including the European Centre’s Interim Reanalysis (ERA-Interim) and the NASA Modern Era Retrospective-Analysis for Research and Applications (MERRA). While the TC representations are much improved over the previous generation of reanalysis datasets, further research is needed to quantify those improvements, which include advancements in data assimilation procedures as well as the introduction of new remote sensing data sources. Thus, as improved data assimilation procedures and more advanced computer systems are developed, it is expected that TC representation will improve dramatically and the calculation of various TC metrics such as power dissipation statistics will be robust and consistent over the past 30-years. Still an unanswered question arises that is addressed in the following section: how well does the PDI estimate of Emanuel (2005) actually represent the overall PD which requires accurate information of the two-dimensional surface wind footprint?
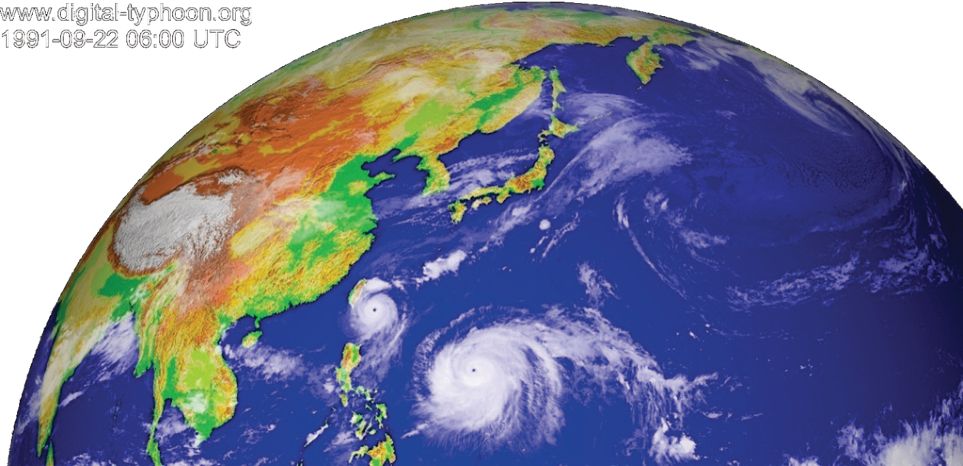
From Figure 7.4, two coincident typhoons in the Western North Pacific Ocean demonstrate the variability in TC size (e.g. Merrill 1984). Typhoon Mireille, the larger of the two typhoons, reached a maximum intensity of Category 4 and was observed with gale force winds at radii of up to 1020 km. At the time of this GMS-4 satellite image (Sept 22 1991 06z) Typhoon Nat was nearing Taiwan and had top winds of 95 knots (one-minute) while Mireille’s intensity was estimated at 110 knots. However, Nat’s maximum radius of gale force winds did not exceed 420 km, which represents 1/6 the surface area as Mireille. Thus, it is important to acknowledge the size of the TC in calculating energy metrics.
Figure 7.4: GMS-4 IR satellite imagery from JMA (courtesy of Digital Typhoon): Typhoons Mireille (TY19) and Nat (TY20) at Sept 22 1991 06z with a powerful extratropical cyclone in the North Pacific. p. 221
p. 198As presaged in the previous section, the independent confirmation of Emanuel (2005) PDI (maximum wind speed cubed) requires an accurate representation of near-surface wind fields. A recent presentation at the annual American Meteorological Society (AMS) meeting in New Orleans (Maue et al. 2008) attempted to ameliorate this issue by using three independent data sources: the extended Best Track (Demuth et al. 2006), H*wind (Powell et al. 1998) analyses, and an objective infrared satellite size analysis based upon the objective intensity techniques of Kossin et al. (2007) and used in Elsner et al. (2008) among others. Again from Equation 1, the average wind within a certain threshold is integrated throughout the lifecycle of the storm to come up with the power dissipation. The tropical storm force or 34 knot wind radius is used as a proxy for the “size” of the storm at least at the surface, which has been shown to be a good approximation (e.g. Dean et al. 2009). Thus, power dissipation from the H*wind analyses or a similar high-spatial resolution operational model dataset, which are gridded, is straightforward using analysis software such as GrADS.
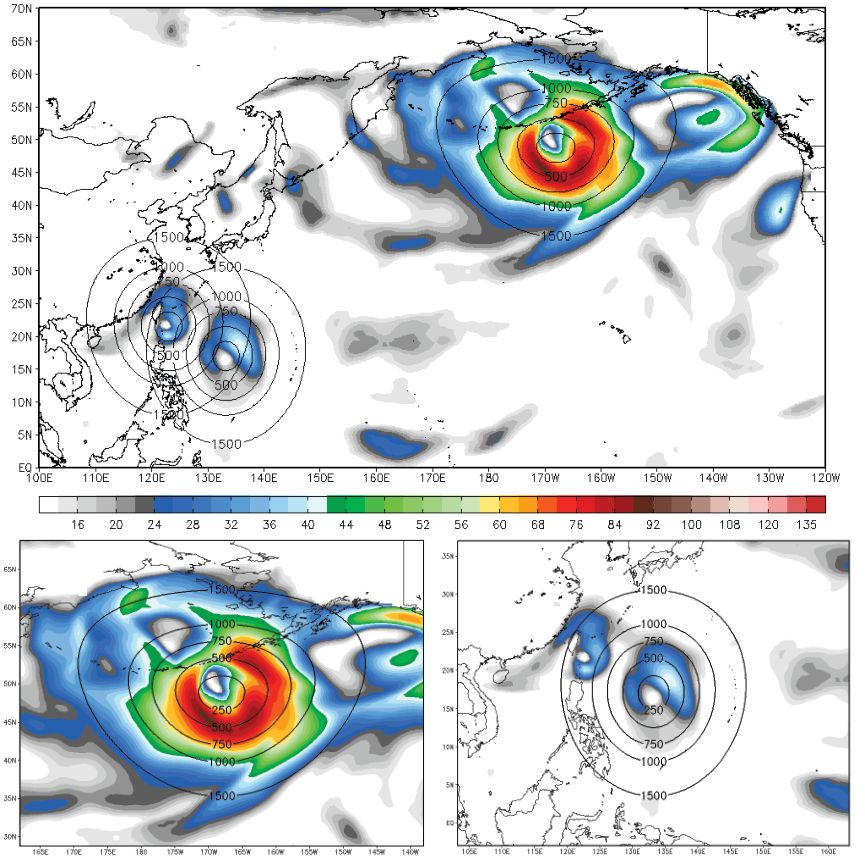
An example of a state-of-the-art reanalysis product’s (MERRA) depiction of TCs is shown in Figure 7.5, which is the analysis at the same time as the IR satellite image in Figure 7.4. The 900 hPa wind speed is shaded with radial contours of distance from the storm center indicated for Mireille, Nat, and the strong extratropical cyclone south of the Aleutian Islands. The radial contours are included to correctly compare and distinguish sizes between the three features since the map projection is not area-conserving. The maximum 900 hPa wind speeds with the two typhoons barely exceeds tropical storm force (34 knots) while the extratropical warm-seclusion has winds in excess of Category 2 if measured on the Saffir-Simpson scale (Figure 7.5bc). This MERRA data is similar in quality to the ERA-40 data that Sriver and Huber (2006) used to determine intensity trends in power dissipation or the analysis of TC structure change from the 1950s. Actually, Sriver and Huber (2006) used 10-meter reduced winds from the lowest reanalysis model level which is significantly less in magnitude than at higher levels such as 900 hPa. Unfortunately as demonstrated, reanalysis datasets are currently insufficient to solve this problem.
Figure 7.5: MERRA analysis of 925 hPa wind speed (knots) for Sept 22, 1991 at 06Z corresponding to the IR imagery of Figure 7.4 with annuli centered upon the respective cyclone sea-level pressure minimum. The warm seclusion and Typhoon Mirelle are zoomed for comparison. p. 222
A different approach was first demonstrated by McTaggert-Cowan et al. (2007) and used by Maue et al. (2008), Fritz (2009), and Yu et al. (2009). With objective cyclone profile information, an idealized, modified-Rankine vortex (reference) is used to construct the overall two-dimensional surface wind field. The modified Rankine vortex expression can be analytically substituted into the power dissipation (PD) equation (Equation 2) and consequently, PD (Equation 4) is expressed in terms of three quantities: maximum sustained wind (one-minute average), radius of maximum wind (R), and tropical storm force radius (r0). α represents the Rankine parameter.
7.4
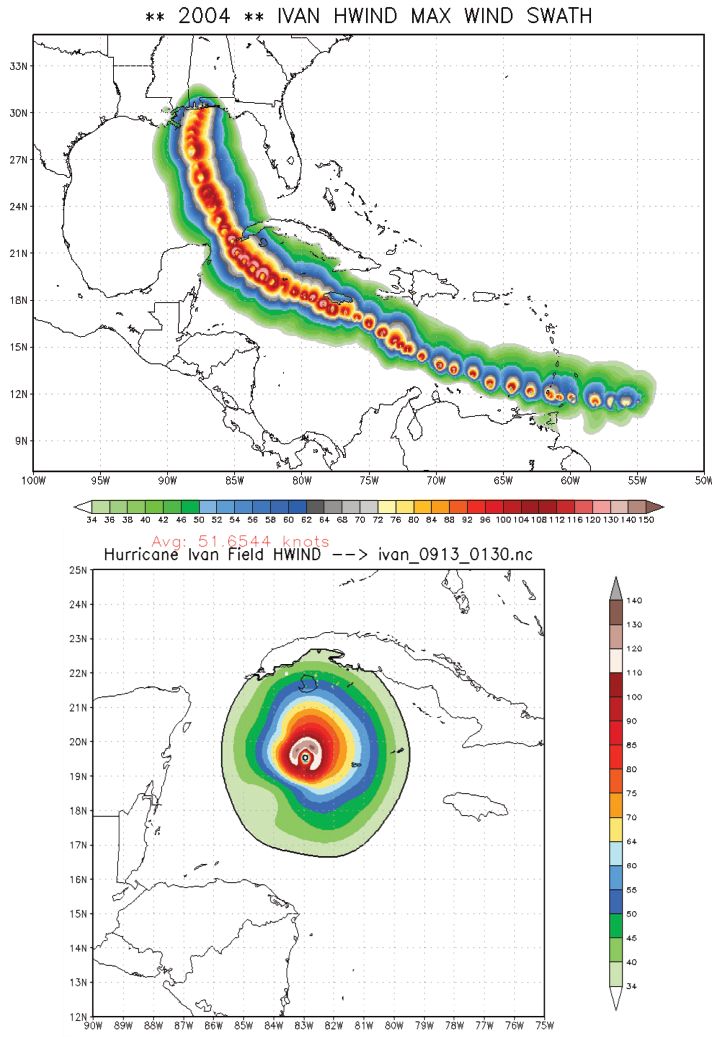
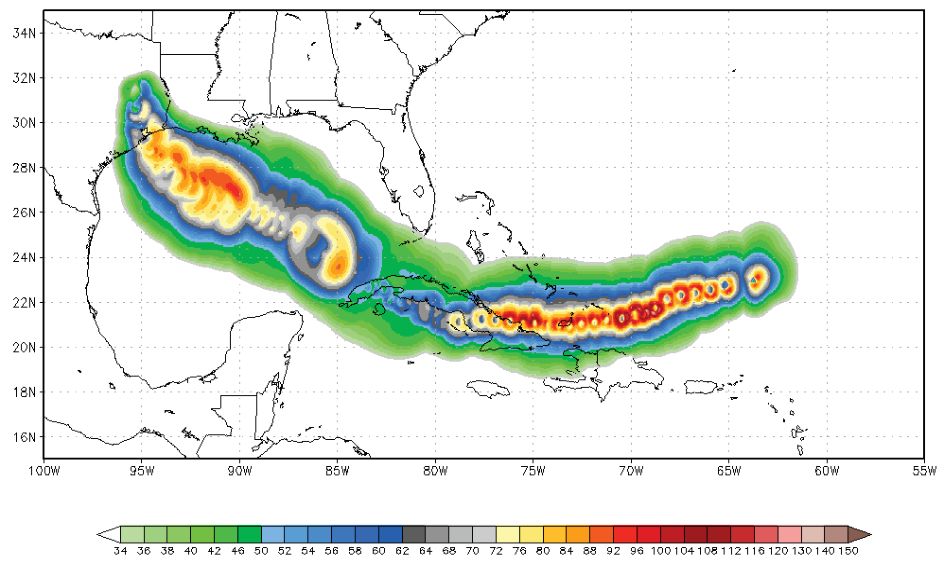
Preliminary results from the extended track data shows that the PD levels off on average for cyclone observations above 100 knots (not shown), which implies that size and intensity (PD) are not well correlated at major hurricane status, which agrees with previous literature. This result is in accord with McClay et al. (2008) who found that the kinetic energy and intensity relationship has considerable variation on a seasonal and individual storm basis. Thus, the PD versus the PDI for individual storms which undergo eyewall changes (McTaggert-Cowan et al. 2007) can illuminate structural changes that may be important for better forecasting of landfall intensity. An example from Hurricane Ivan (2004) of the surface wind field evolution is plotted from the H*wind analysis (Figure 7.6) in a maximum wind speed swath map. It is clear that the size and asymmetry of the wind field evolve considerably throughout Ivan’s lifecycle with significant changes in the gale and hurricane force wind radii. The size and intensity of the cyclone is dependent upon many factors including the ocean surface temperature and underlying heat content as well as the atmospheric thermodynamic conditions (Emanuel 1999). A snapshot at 01:30 UTC on September 13, 2004 for Ivan shows the very large wind field of Ivan (Figure 7.6b). The average wind inside the 34-knot wind threshold is 51.7 knots, which is then multiplied by the area of 34-knot radii to calculate the power dissipation (assuming a constant drag coefficient). A similar wind swath map is shown for Hurricane Ike from the 2008 North Atlantic hurricane season (Figure 7.7). Ike’s translation speed was faster than Ivan which accounts for the fewer number of H*wind observations. The disruption by Cuba clearly restructured Ike into a larger, less intense cyclone but with increased power dissipation due to the size enhancement.
Figure 7.6: (a) Real-time H*wind Ivan 2004 maximum wind speed swath (> 34 knots) analysis (left) for H*wind analysis/observation times from 06:30Z September 6 to 07:30Z September 16 and (b) H*wind September 9 01:30 Z surface wind analysis (> 34 knots). p. 223Figure 7.7: Real-time H*wind maximum wind speed swath (> 34 knots) for Hurricane Ike (2008) from 19:30Z September 5 to 16:30Z September 13 (56 individual analyses). p. 224
p. 199Thus, further exploration of the relationship between TC size and maximum intensity is required in order to independently verify the assertion made in Emanuel (2005) that TC power has indeed doubled over the past 30 years. The objective satellite reanalysis dataset developed by Kossin et al. (2007) at the University of Wisconsin has provided several other preliminary results. Additionally, the results of Webster et al. (2005) and Emanuel (2005) are related since the strongest TCs or those that exceed 115 knots (maximum sustained winds) and are designated Category 4 or 5, have reportedly increased in frequency during the past 40-years.
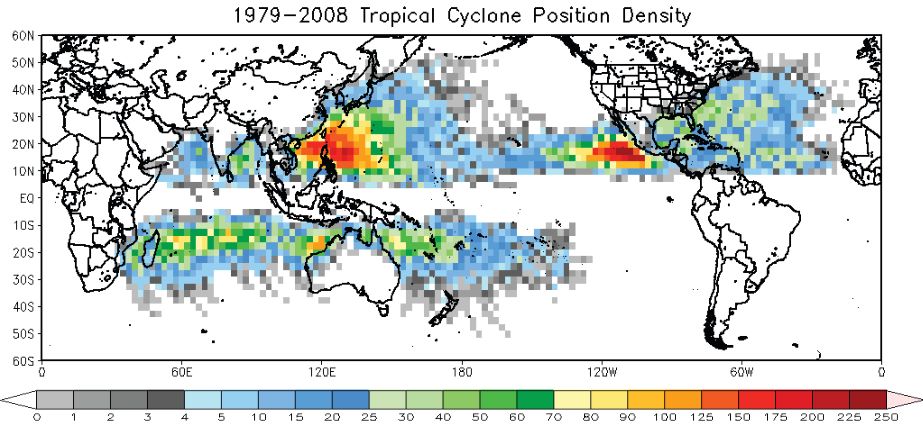
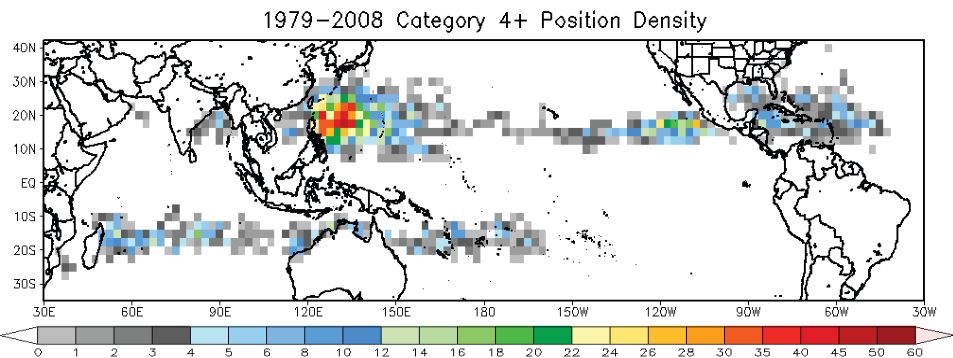
TCs require specific thermodynamic requirements including sufficient sea-surface temperatures as well as seedling vorticity disturbances. Figure 7.8 is a density map of TC positions over the past 30-years allowing for global comparisons. The most densely populated region on the globe is the eastern North Pacific off the coast of southern Mexico, while the North Atlantic is rather diffusely populated by TC tracks. The Northern Hemisphere has many more TCs than the Southern Hemisphere. Figure 7.9 demonstrates that the spatial coverage of Category 4+ TC observations is comparatively very small and concentrated in specific tropical latitudes mainly the warm pool location in the western North Pacific. While the total number of category 4+ observations is 3317 globally during the past 30-years, the designation of a cyclone only requires one such observation. Thus, the secular or categorization metrics of TC activity are considerably more sensitive to data quality than integrated or accumulated metrics. Thus, the power dissipation variability and trends in these regions should be the most important for long-term maximum intensity trend diagnosis.
Figure 7.8: Density of TC positions in the various basins [2.5x2.5 degree bin sizes] for all position points that are tropical in nature and exceed 34-knots one-minute wind speed for 1979- 2008 from the JTWC+NHC best-track datasets. p. 225Figure 7.9: Density of TC positions in the various basins [2.5x2.5 degree bin sizes] for all position points that are tropical in nature and exceed 114-knots or Category 4 (one-minute) wind speed for 1979-2008 from the JTWC+NHC best-track datasets. p. 226
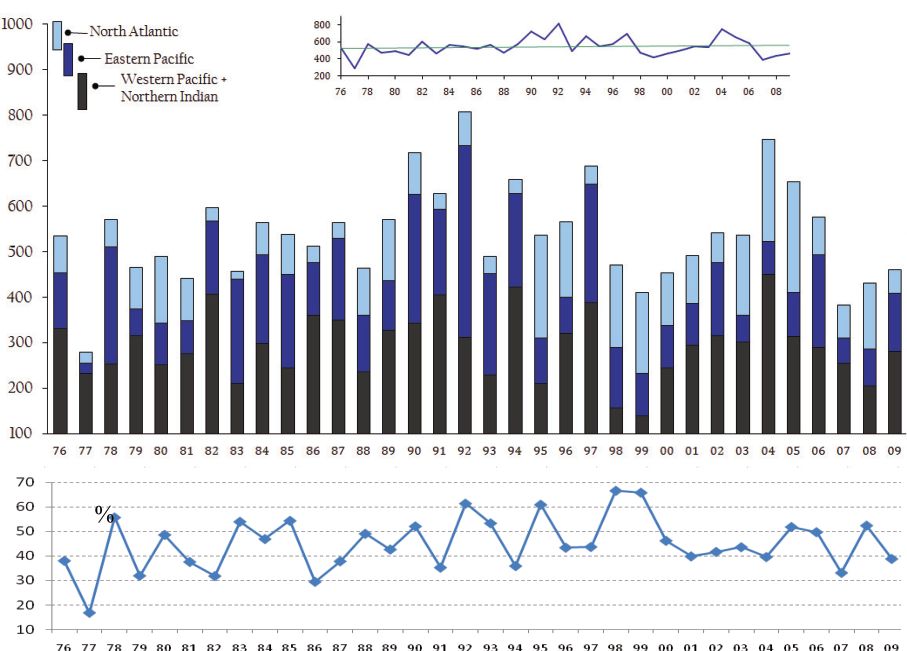
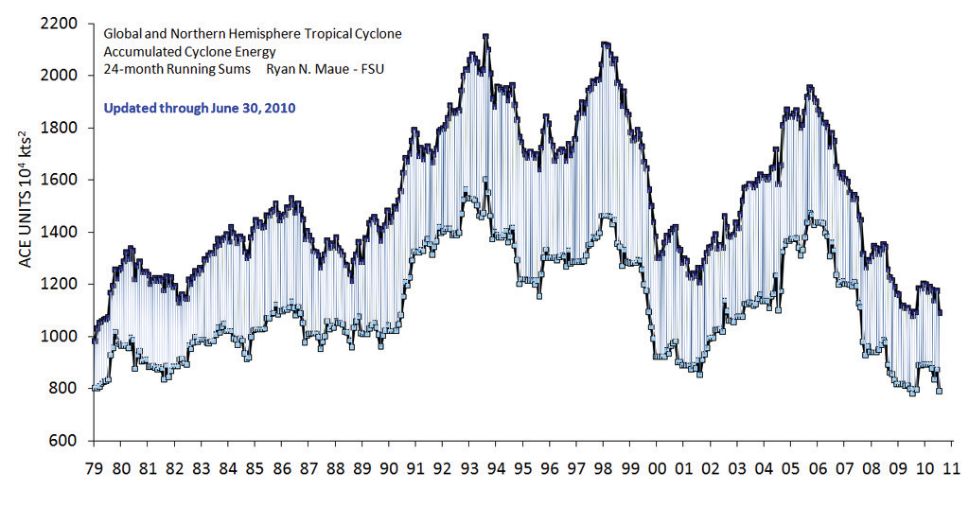
It is well known that the global TC activity of the past 30-years (the satellite observing era) has large interannual variability. Each respective TC basin is modulated by both local and global scale climate influences. For the Northern Hemisphere (NH) as a whole, the past 30-years show considerable variability but no significant upward trend (Figure 7.10a from Maue 2009). Moreover, in 2007, the NH accumulated cyclone energy (Bell et al. 2000; ACE), analogous to the Emanuel’s power dissipation index (PDI; wind speed cubed) but with wind speed squared, was the lowest on record since 1977. Similar record low ACE values persisted throughout 2008 into the summer of 2009 when the effects of El Niño began to accelerate Western North Pacific typhoon activity.
Figure 7.10: (a) Raw values of Northern Hemisphere and individual basin ACE from 1976 – 2009 (shaded bar chart). The stacked bars include ACE for the Western Pacific + Northern Indian Oceans (WPAC+NIO) (bottom), Eastern Pacific (EPAC,middle), and North Atlantic (NATL, top; darkest) basins. (b) Ratio of NH ACE occurring in the EPAC+NATL in percent from 1976-2009. Updated from Figure 1 of Maue (2009). % p. 227
p. 200During Dr. Clarke’s Equatorial Dynamics oceanography course in spring 2008, a term project was selected that focused upon ENSO’s effects upon TC activity, mainly in the Pacific basin. The initial research hypothesis focused specifically upon the intensity and duration distributions as a function of warm El Niño and cold La Niña events in the Pacific. The timeline of the course matched closely with a record-strength La Niña episode wrapping up in the winter of 2007-2008. Thus, with the marked decrease in Pacific ACE, La Niña was posited as a potential large-scale climate modulator of TC activity. A manuscript eventually resulted from this work. Published in Geophysical Research Letters, Maue (2009) examined the relationships between SST and Northern Hemisphere TC activity, which was motivated by the term project.
#7.5.1 ENSO effects on the tropical cyclone climatology
Considerable research has addressed the effects that the El Niño Southern Oscillation (ENSO) may have on global TC frequency, intensity, and location through a variety of mechanisms. Gray (1984) showed NATL hurricane activity was correlated with ENSO and based a statistical seasonal forecasting technique upon that information. Eastern Pacific basin activity tends to be enhanced during El Niño years with a westward shift of more intense TC tracks while activity is overall suppressed in the NATL (Elsner and Kara 1999). Also, lower vertical shear and greater low-level relative vorticity is found during El Niño in the central Pacific (Wu and Lau 1992). An example of a Southern Hemisphere effect occurs near the dateline in the South Pacific as equatorial westerlies expand with the monsoon trough favoring possible cases of twin-TC formation on either side of the equator (Ferreira et al. 1996). Likewise, Ramsay et al. (2008) reported strong evidence that SST over the central and eastern Pacific is a main contributing factor to interannual variability of TC activity in the Australian region.
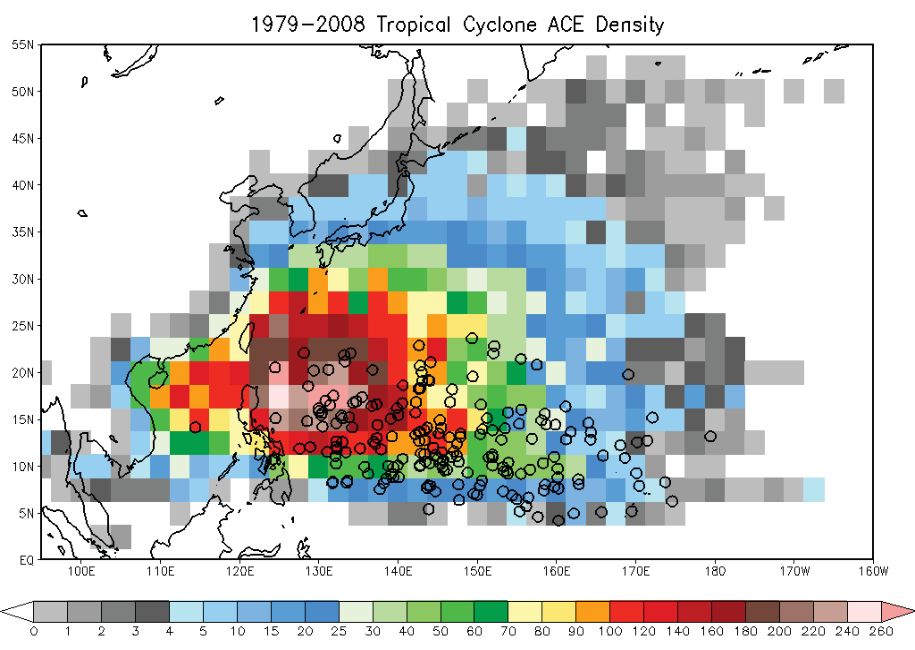
The most widely recognized El Niño effect on WPAC typhoon activity involves the eastward migration of the genesis region towards the dateline. This breeding area allows for the development of longer-lived, more intense, and larger typhoons since they spend more time over warm sea surface temperature (SST) and in a very favorable synoptic environment (e.g. Wang and Chan 2002; Carmargo and Sobel 2005). As described before, accumulated cyclone energy (ACE; Bell et al. 2000) is the convolution of lifespan, intensity, and frequency and describes individual or seasonal TC activity. ACE is the summation of the maximum observed wind speed (6-hourly reports) squared during a storm lifecycle (Equation 1). Since each factor is not independent, i.e. long-lived storms are typically more intense, the deconvolution is not unique. Nevertheless, it serves as a valuable indicator of seasonal activity when an entire basin’s activity is integrated. As Figure 7.8 showed the normalized density of storm reports from 1979-2008 in the WPAC basin with a clear maximum east of the Philippine archipelago and in the South China Sea. The easternmost maximum is highly correlated with ACE (Figure 7.11) which shows the convergence of frequent and high-intensity TCs into this bull’s-eye region. This is also a typical recurvature latitude for typhoons which is also closely related with the maximum intensity. The genesis locations of Category 4 and 5 supertyphoons is indicated by the open circles overlaid on top of the TC ACE density (Figure 7.11). Indeed, the longer tracks of the strongest typhoons originate further to the east, with only sparse genesis of intense typhoons west of 130ºE.
Figure 7.11: (a) Normalized ACE density map for all WPAC TC positions and intensities > 34 knots in 2.5ºx2.5º bins with the shading magnitude according to the colorbar. The black open circles are genesis locations (first tropical storm observation) of Category 4+ typhoons for the period 1979-2008. p. 228
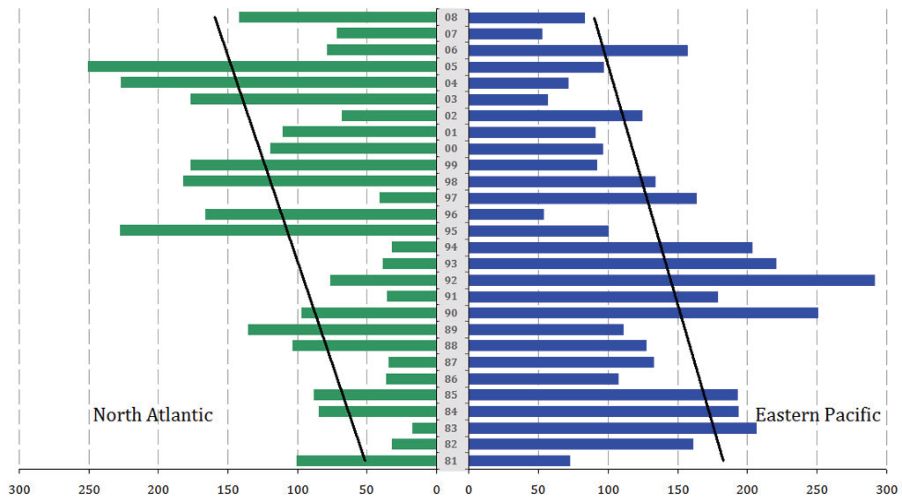
p. 201Over the past 30 years, the WPAC has accounted for a nearly constant 55% of overall Northern Hemisphere (NH) activity (Figure 7.10a). The remainder (~40%) has been split between the Eastern North Pacific (EPAC) and the NATL, which are significantly anti-correlated since 1976 with no trend. The author hypothesizes that the increase in activity in the North Atlantic since 1995 has removed seedlings or African Easterly Waves from entering the EPAC, a preferential mode for development in combination with the local monsoon trough. The NH ACE (Figure 7.10a) does not have a significant trend since 1976, which is during both a known inactive period in the NATL (Goldenberg et al. 2001) and the WPAC (Chan et al. 2005). Indeed 2007 and 2008 represented one of the weakest NH TC ACE periods on record nearing the lows last seen in 1977. This is not surprising considering the typical negative effects of La Niña on ACE as experienced during the boreal summer and autumn of 2008.
#7.5.2 El Niño effects on genesis location in the Western North Pacific
Several mechanisms have been proposed to explain the differing behavior of TC formation during and El Niño episode: the enhancement of activity in the southeastern portion of the WPAC basin. Chan (1985) suggested that the effects of an anomalous Walker circulation were responsible for enhanced air ascent in the central equatorial Pacific with competing descent in the west that likely dampened or suppressed convection. An example of this convective asymmetry was presented in Clarke and Kim (2005) through time series of outgoing longwave radiation (OLR). This eastward genesis shift is also explained by an extension of the monsoon trough (Lander 1994). It is noted that the Walker circulation mechanism is stronger during the latter months of the year (October-December) since many TCs form near the equator in a region with ENSO-enhanced or induced low-level circulation anomalies.
When examining the relationship between ENSO and sea-surface temperatures (SST), it is important to recognize that the sign and amplitude of equatorial Pacific SST anomalies may change throughout the year (Wang and Chan 2002). For instance, during the development of an El Niño (1965, 1968, 1972, 1976, 1982, 1986, 1997, 2006), early season near-normal SST anomalies evolved into peak-high anomalies during the late season. After the El Niño matured (1970, 1983, 1992, 1995, 1998, 2007), the previous season’s warm anomalies progressively cooled into the next peak TC period. A methodology of examining the behavior of TCs during strong Niños and strong Niñas involves a simple segregation of one-sigma anomalous events (Wang and Chan 2002). When moderate Niños or Niñas were chosen, much less clear signals were apparent.
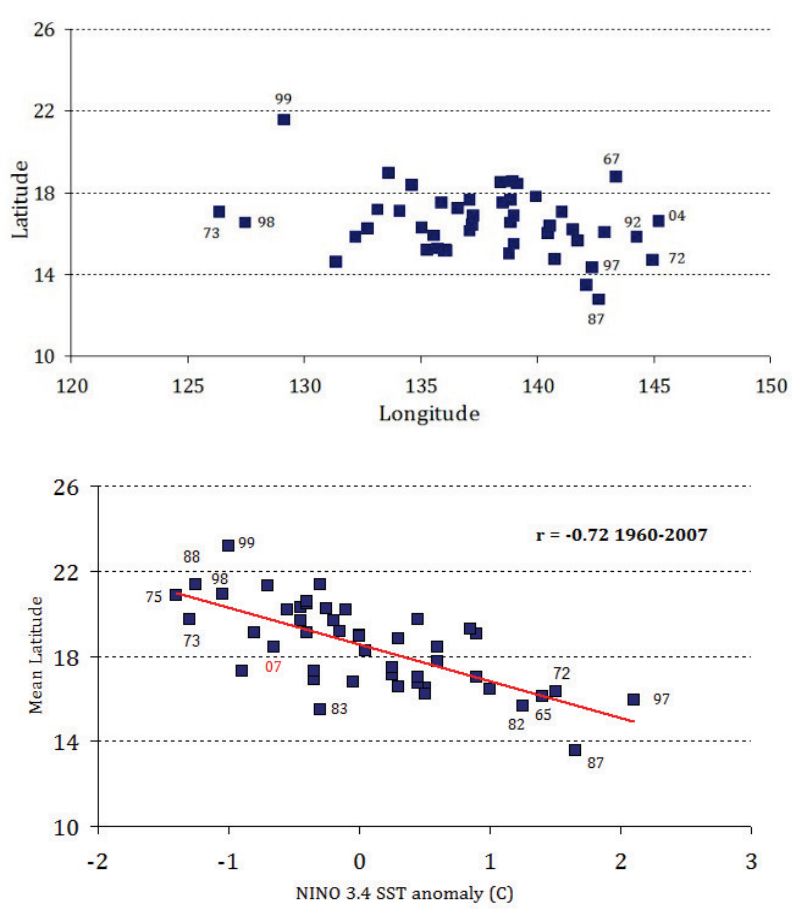
Although the total number of tropical storms formed in the entire WPAC does not vary significantly from year to year, during El Niño boreal summer and autumn, the frequency of TC formation increases markedly in the southeast quadrant (0º–17ºN, 140º E – 180º) and decreases in the northwest quadrant (17º–30ºN, 120º–140ºE). The July–September mean location of TS formation is 6º latitude lower (Figure 7.12a), while in October–December, the genesis location is 18º longitude eastward in the strong warm versus strong cold years (Wang and Chan 2002). Figure 7.12b is a scatter plot of the mean-latitude of peak season (July-September) WPAC TC genesis from 1960-2007 correlated with Niño 3.4 SST anomaly (SSTA). The strongest La Niñas (1973, 1975, 1988, 1998, 1999, 2007) see higher latitude development and are closely related with negative Niño SSTA while the strongest El Niños (1965, 1972, 1982, 1987, 1997) all see low-latitude genesis with much above normal Niño 3.4 SSTA. The correlation is highly significant with r = -0.72.
Figure 7.12: (a) WPAC scatter plot of genesis regions for TCs during the peak season (July – September) with selected individual years highlighted. (b) WPAC scatter plot of Niño 3.4 SST anomaly and 1960-2007 mean seasonal genesis latitude during the peak season (July- September). Individual years are indicated on the plot. p. 229
p. 202This robust relationship between latitude and the extremes of ENSO are important for WPAC TC basin predictability and yield relationships much higher than one would see without segregating into strong events. Moreover, with implications for ACE, the average lifespan of peak season TCs is also highly correlated with Niño 3.4 SSTA (r = 0.78, not shown). Thus, one would expect considerably higher ACE during El Niño years, which is borne out in the observations presented partly in Figure 7.10a. Also important for ACE, during warm years, there is a significant increase in the frequency of northward recurving TCs, which form in the SE quadrant of the WPAC and tend to recurve from northwestward to northeastward around 28ºN, 135ºE. The ratio is about 3 to 1 in terms of storms that reach north of 35ºN and have the opportunity to undergo extratropical transition when comparing strong warm and cold years. Since the TCs avoid land, they continue to accumulate ACE throughout a longer lifecycle. An overall summary of the major changes expected is presented in Table 2.
Table 7.2: A summary of the major effects seen between the strongest El Niño and strongest La Niña events during the past 40 years as explained largely in Chan and Wang (2001).
Effects
El Niño
La Niña
Early Season TC Formation (Jan-July)
Suppressed after
Enhanced
Mean TC Life Span (Wang and Chan 2001)
7 days (total season 159)
4 days (84 days)
Fall recurving storms or those that exceed 35º N latitude.
250% increase over Niña
1
Formation Region (Figures 5.12a,b)
SE Quadrant [5º-17º N, 140º E-180] 31 vs. 2 for Niño vs. Niña 74% formed south of 17ºN
NW Quadrant [17º-30º N, 120º-140ºE] 28 vs. 7 for Niña vs. Niño 75% formed north of 17ºN
Li (1988) postulated that local SST anomalies influence the TC formation regions, especially on interannual time-scales. However, deep convection depends on the critical value of 28º C (Graham and Barnett 1987), which is found nearly everywhere in the WPAC tropics implying that atmospheric dynamics are fundamental to understanding the seasonal mean TC formation regions. Camargo et al. (2007) used NCEP reanalysis data to calculate a multiple-regression TC genesis index (Emanuel and Nolan 2004) and conducted a sensitivity study to determine ENSO’s effect on global TC genesis. As a component of the genesis index, the maximum potential intensity (MPI, Emanuel 1988) of a TC is a metric that contains both oceanic (SST) and atmospheric information (vertical humidity and temperature profiles) and describes a theoretical limit of a TC’s kinetic energy (wind speed, pressure). It was found that the WPAC during an El Niño year sees much weaker MPI yet the typhoon intensity is markedly higher.
This evidence does not support the Li (1988) hypothesis of local SST anomaly influences, but suggests that El Niño-year typhoons may actually come closer to reaching their theoretical limit of intensity since their lifecycles are considerably enhanced. Several papers have investigated the influence of local SST versus non-local SST such as Niño-3.4 on interannual typhoon activity (e.g. Chan and Liu 2004). While there is significant interdecadal variability in WPAC typhoon frequency and intensity, no relationship is found with respect to rising local SSTs (and none when ENSO is removed using partial correlation analysis; Chan and Liu 2004). The exception is the SE quadrant of the WPAC or the shifted genesis region. Instead, here it is postulated that atmospheric teleconnections of ENSO (e. g. Alexander et al. 2002) due to the warming of the central and eastern Pacific result in weaker vertical shear, increased low-level cyclonic vorticity, and higher moist static energy.
The anomalous atmospheric circulation for warm events almost mirrors that for cool episodes. The vertical motion-induced cooling in the tropics is primarily balanced by diabatic heating (convection) on the seasonal mean timescale, and the ascending (descending) motion is a meaningful indication for atmospheric heat source (sink). During strong warm years, the organized anomalous ascending motion concentrates in the SE quadrant of the WPAC while anomalous descending motion is found in the NW quadrant. The converse is generally true during a strong La Niña.
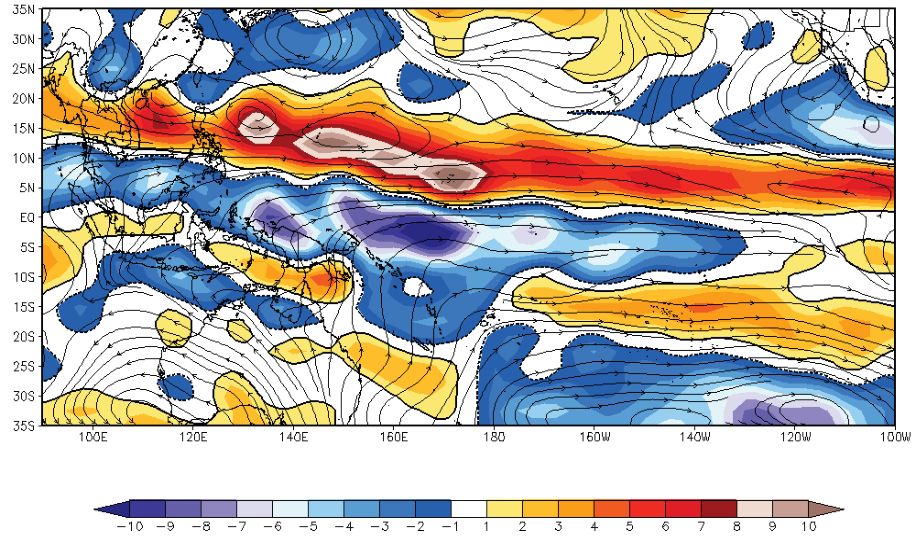
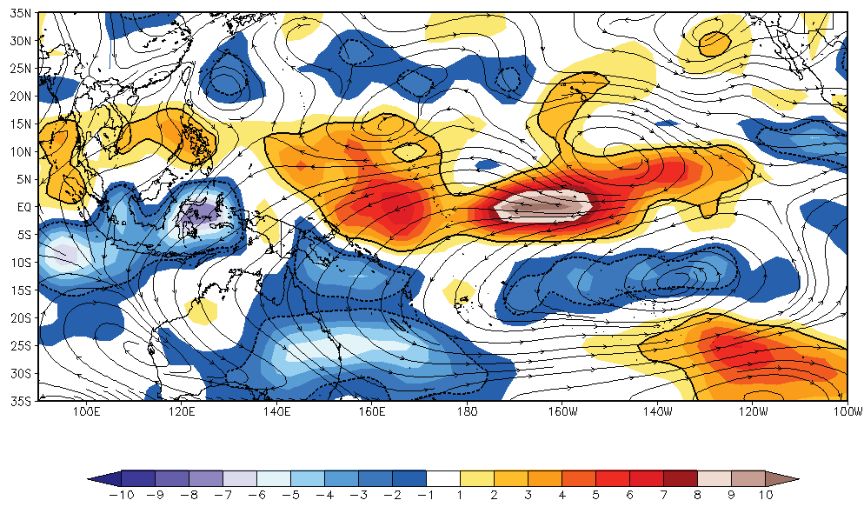
p. 203Wang and Chan (2002) hypothesized that the anomalous heat source pattern in the WPAC results from lower boundary forcing associated with the equatorial SST anomalies. During the warm years, the equatorial central and eastern Pacific warming increases equatorial convective heating near the date line and induces pronounced equatorial westerly anomalies in the western Pacific. Large meridional shears associated with the equatorial westerly anomalies increase low-level vorticity in the SE quadrant. Since the boundary layer convergence is proportional to the 850-hPa relative vorticity, the background vertical motion is well correlated with the 850-hPa vorticity (r=-0.80). This increased background low-level vorticity would increase moisture convergence and by entraining potential vorticity in the developing TCs. There is a high-correlation between 850-hPa relative vorticity and TC formation in the SE quadrant. Figure 7.13 shows a composite difference between 7 strong El Niño and La Niña events each of 850 hPa relative vorticity as well as vector wind anomalies (streamlines). The monsoon trough is highly amplified during warm events and westerly winds are clearly identifiable.The El-Niño induced central Pacific heating also generates a pair of huge anomalous upper-level anticyclones on either side of the equator. At 500 hPa (not shown), the Asian trough is deeper than normal (warm year) as well as the subtropical anticyclone in the central western Pacific. Northwesterly flow east of the Asian trough and anomalous southeasterly flow behind the subtropical anticyclone generates strong upper-level convergence and may be responsible for the observed descending motion in the NW quadrant. The deepening of the Asian trough also provides a favorable steering flow for the TC recurvature around 135ºE. Figure 7.14 is similar to Figure 7.13 but for 200 hPa divergence. The upper-level divergence out of the region of maximum anomalous heating is very robust as well as anomalous easterly winds west of the dateline.
Figure 7.13: El Niño – La Niña composite relative vorticity anomalies (x1e6 s-1) at 850 hPa (shading)and anomalous vector wind streamlines using NCEP/NCAR reanalysis data from 1965 – 2007. The 7 warm years chosen are 1965, 1972, 1982, 1987, 1997, 2002, and 2006. While the 7 cold years are 1970, 1973, 1975, 1988, 1998, 1999, 2007. NCEP/NCAR Reanalysis data obtained from the Climate Prediction Center. p. 230Figure 7.14: As in Figure 7.13 but for 200 hPa divergence (shaded, scaled x 2e6 s-1). p. 231
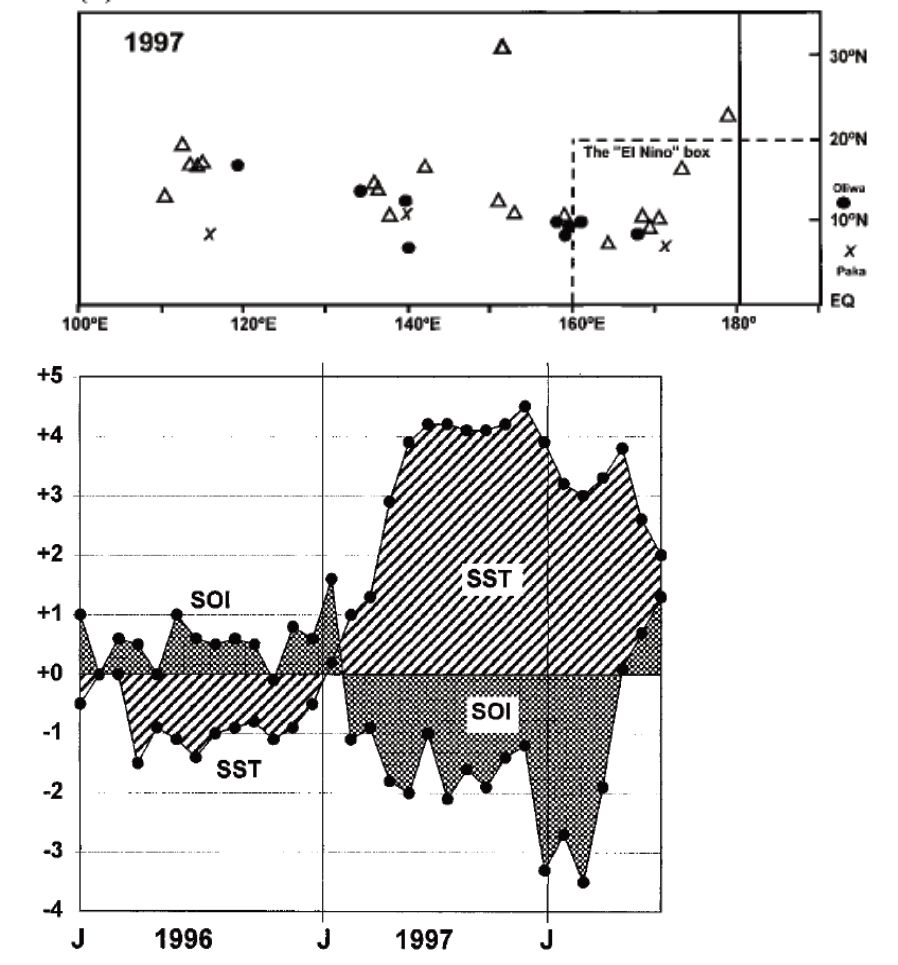
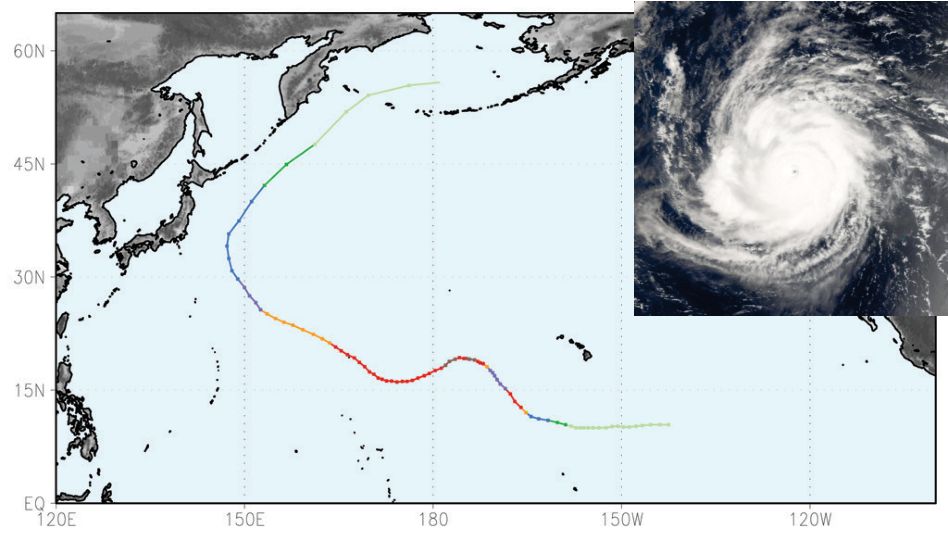
The 1997-1998 El Niño greatly enhanced WPAC typhoon activity over a variety of metrics. While the overall number of named TCs was near-average, the number of typhoons (23) was the highest since 1971 with 11 of those becoming “super-typhoons” (maximum winds of 130 knots+), a historical record first (previous high was 7 in 1971, 1987, 1989, and 1991). As seen with other strong El Niños, the mean TC genesis location was displaced to the east (Figure 7.15a). Early in the year, persistent low-level westerly winds developed at low-latitudes which established a near-equatorial trough across Micronesia. The chart of the SOI and SSTA (Figure 7.15b) shows the evolution from La Niña to a very strong El Niño with much above average SST in the central equatorial Pacific. This environment was conducive for much above normal TC activity prior to July, the nominal beginning of the peak season. From the chart below, the genesis locations of the 1997 season shows a clear low-latitude and eastward oriented pattern. The “El Niño” box, as defined by Lander and Guard (2001), highlight the development of many of the these storms, of which a preponderance of the most intense, meaning those that go on to become super-typhoons, typically develop in this region during strong El Niño episodes.
Figure 7.15: (a) As in 4a, genesis location for 1997 WPAC TCs. Oliwa and Paka translated in from the Central Pacific. The El Niño box is denoted by the dotted subsection south of 20ºN and east of 160ºE. The symbols indicate solid dots = Jan 1 – Jul 15, open triangles = July 16 – Oct 15, and X = Oct 16 – Dec 31. (b) Monthly mean anomalies for the eastern equatorial Pacific SST (ºC hatched) and the Southern Oscillation Index (SOI) (shaded) for the period 1996-1997. (From Lander and Guard 2001). p. 232
The upper-tropospheric wind pattern showed easterly wind anomalies over most of the low-latitudes of the WPAC, which was almost the reverse of 1995 and much of 1996. Overall, the 1997 WPAC TCs tended to be large, intense, and slow-moving or long-lasting. This combination of a longer lifecycle and higher intensity contributed greatly to the hyper-active nature of NH ACE (Figure 7.10). Generally, the storms were singular in nature, highlighting a possible different mechanism of post-genesis intensification and development as compared with a non-El Niño year. Usually during the peak of the season, during July – October, many TCs can co-exist and possibly interact in the basin. However, during 1997, the storms tended to develop one after another, but only after the previous storm completed recurvature and left the tropics, either undergoing extratropical transition or simply decaying over colder waters beneath high-vertical wind shear.
p. 204During October of 1997, westerly winds continued to blow near the equator along 150ºE to 170ºW which aided in the development of twin near-equatorial troughs and considerable convection. As the convection bounded by the westerlies decreased, three separate TCs developed, Ivan and Joan in the NH and Lusi in the Southern Hemisphere (SH). Concentrating on Ivan and Joan, the environment in which their nascent disturbances developed was not overly favorable. Indeed, the convection had largely diminished, the monsoon trough had weakened, and little monsoon flow existed to the south and west. Yet, Ivan and Joan began as poorly organized areas of low-pressure but evolved together into the strongest pair of co-existing TCs on record, attaining 160 knots maximum sustained winds within 12 hours of each other. Joan remained at super-typhoon intensity for over 4.5 days, a record up to that time. It is an interesting research question as to why these storms attained such intensity even when forecasters expected much less (Lander and Guard 2001). Likewise, the record lifespan of Hurricane Ioke at similar intensity provided almost 20% of the 2006 yearly NH ACE on its own (Ioke ACE was 86).
A renewed interest in TC effects on ENSO, rather than the converse, has led to some interesting arguments about possible feedbacks by typhoons on their large-scale environment which may lead ENSO reinforcement. The overall goal of such research is not only understand the large-scale circulation characteristics which are favorable for TC develop but also gauge the overall effect that the TCs may have on interannual variability of the ocean-atmosphere system in the WPAC (e.g. Sobel and Camargo 2005). Observations indeed show a considerable SST cooling in the wake of TC tracks on the order of 3-5°C for the strongest typhoons. For succeeding systems, this cooler SST may inhibit the maximum potential intensity (Emanuel 1988) theoretically possible. Similar research with contributions from this author attempted to quantify the “memory” or the temporal scale of TC effects on the large-scale environment and found that considerable MPI anomalies may exist for many weeks (Hart et al. 2007). This is largely accomplished through cooling and drying of the atmospheric column which is related to observed outgoing long-wave radiation (OLR) reduction; these are likely non-linear feedbacks of upwelled water along the TC track and cooler than climatology SSTs. All of the preceding examples of feedbacks are decidedly negative for future TC development and maximum attainable intensity.
Sobel and Camargo (2005) suggested that during a relatively strong El Niño event, since nascent TCs develop much further to the east, westerly wind anomalies associated with the broad circulation may in fact strengthen an incipient El Niño. The main mechanism is a straightforward amplification of the upper-ocean SST anomaly in the eastern and central equatorial Pacific. It is noted that this explanation is essentially the Bjerkenes (1969) hypothesis with other mechanisms added. Thus, the main question is whether the TC-induced equatorial westerly wind anomalies are of sufficient scale both spatially and in time to contribute materially to the ENSO. A simple deformation radius argument suggests that near-equatorial TCs could generate equatorial westerly wind anomalies and project onto atmospheric equatorial Kelvin waves, however, further research is needed.
#7.5.7 Predictability of Western Pacific and Northern Hemisphere ACE
p. 205Many studies have found no significant linear relationship between TC frequency overall in the WPAC and ENSO, but strong non-linear forcings are fundamental to many successful TC seasonal prediction schemes (Carmargo and Sobel 2005). First, ACE and ENSO are closely correlated and significant correlations begin as early as February of the year of a developing ENSO event and last until as late as May-July of the following year (Carmargo and Sobel 2005, their Figure 3). Second, as seen with ENSO, there are high simultaneous correlations with ACE but autocorrelation of Niño processes is not suggested as the sole explanation for the simple fact that ACE leads Niño indices. These high simultaneous correlations show that predictions of Niño indices are very valuable for WPAC TC prediction. The right column of Table 3 shows significant correlations between ACE and Niño 3.4 over the past 26 years with a 1-2-1 filter applied during April-June. Thus, several months prior to the peak of the TC season, this Niño index explains some variance, but not as much when the strongest events are segregated, as explained before.
Table 7.3: Relationships between ACE and SSTA in the North Pacific [44º- 50º N, 210ºE - 225ºE] and the Niño 3.4 region. Bold is significant at the 99% level. Italics at 95% level
Basin
Correlation (NPAC) SST 1982-2007 (1-2-1 filter)
Correlation with NIÑO3.4 AMJ (5°N-5°S, 120°W-170°W)
Northern Hemisphere ACE
0.94
0.57
Western Pacific ACE
0.88
0.60
East Pac ACE
0.18
0.47
Atlantic ACE
0.23
-0.30
Since Northern Hemisphere ACE was shown to be at a 30-year low during the period of 2007 to the summer of 2009, the author hypothesized that the strong developing La Niña contributed to the overall dearth of TC activity. Not only were TCs weaker than climatologically normal, but they were short-lived, infrequent, and failed to recurve as readily. Since the NH ACE is a combination of the three major basins, the EPAC, NATL, and WPAC, using ENSO as a predictor shows reasonable skill (r=0.57, Table 3). However, when the NH ACE time series from 1982-2007 is regressed upon monthly averaged SST from April-June, a transhemispheric correlation pattern is exhibited (Figure 7.16).
Figure 7.16: (Top) Correlations between August-October monthly mean SST (1981-2008) and North Atlantic ACE following the method of Emanuel (2005). (Bottom) Correlations between April-June monthly mean SST (1981-2008) and Northern Hemisphere combined ACE p. 233
Figure 7.16 shows a striking highly correlated region (r>0.95) in the Gulf of Alaska, a region of SSTs averaging 9 - 11ºC during the boreal spring and summer, is surprising for a couple reasons. First, the Gulf of Alaska is well away from the primary ENSO forcing but near the “node” of the major Pacific Ocean midlatitude teleconnection patterns. Second, this region shows a maximum correlation during April-June, well prior to the peak TC activity seen in the NH. Hence, it may serve as a predictor for overall NH ACE, while other predictors could be used for individual basins. By simple deduction, well-predicted basins such as the WPAC and EPAC could be subtracted from the NH whole to back out the NATL hurricane activity in the following fall. This implies that there is a finite amount of ACE or TC energy which will be released during a given year, which is not necessarily in accord with one recent study. Frank and Young (2007) found no evidence of compensation between separate basins, meaning anomalous activity in one basin did not portend opposite or similar behavior in another. However, this does not rule out the role of interannual variability such as ENSO to regulate overall NH (and global) TC activity. This research motivated a further examination of Northern Hemisphere TC activity as described in Maue (2009) and the following sections.
p. 206Recent historical Northern Hemisphere (NH) TC (TC) inactivity is compared with strikingly large observed variability during the past three decades. Yearly totals of the combined active-basin NH accumulated cyclone energy (ACE) are highly correlated with boreal spring sea-surface temperature (SST) in the North Pacific Ocean and are representative of an evolving dual-gyre, trans-hemispheric correlation pattern throughout the calendar year. The observed offsetting nature of Eastern Pacific and North Atlantic basin ACE during the past three decades and a strong dependence combined Pacific TC activity upon the El Niño-Southern Oscillation reflect the interrelated modulation of overall NH integrated TC energy by large-scale modes of climate variability. Thus, the quiescent period of overall integrated NH TC ACE continuing throughout 2008 is not unexpected in the context of previous periods of colder Pacific SSTs.
Northern Hemisphere TC ACE is exemplified by considerable interannual variability. During the past 30-years, calendar year 2007 produced the lowest-ACE with unusually weak TCs throughout the major active basins (Figure 7.10).
The North Atlantic (NATL) and Eastern Pacific (EPAC) basins have largely compensated for each other during the last 30-years in terms of integrated TC activity (Figure 7.17). Both basins have significant but opposite trends with basin activity markedly changing from 1994 to 1995.
In the NATL, filtered seasonal totals of ACE are poorly related with ENSO as shown by weak correlations of August-October Hadley Centre SST (Rayner et al. 2007) in the tropical Pacific with NATL ACE (Figure 7.16a). It is apparent that the global warming trend in low-frequency NATL SSTs is exceptionally well correlated with the upward trending NATL ACE (or PDI) from 1981-2008, which has been demonstrated by Emanuel (2005) for the NATL main development region (MDR). However, the similarly high correlations in austral winter in the South Pacific demonstrate the difficultly in attributing NATL integrated TC metrics to coincident trends in local SST (Kossin and Vimont 2007; Vecchi and Soden 2007b; Swanson 2008).
The entire NH ACE and global SST correlation map (Figure 7.16b) for the period 1981-2007 exhibits a striking trans-hemispheric scale, double gyre structure with very high correlations in the North Pacific during boreal spring (April-June).
Figure 7.17: 1982-2008 TC ACE for North Atlantic and Eastern Pacific basin. Calendar year (tropical storm force or > 34 kt observations) from Figure S3 of Maue (2009). p. 234
“It is not clear why the number of global cyclones each year (80-90) has remained a long-term constant of nature. Previous analysis showed that the interannual variability in large-scale climate patterns affected TC formation regions and intensity in different ways [Frank and Young 2007]; this conclusion is clearly in accord with previous TC climatology studies including the results presented here. Global and NH ACE are not a constant of nature [Klotzbach 2006], and undergo significant variability as exemplified by the tepid totals of 2007 and 2008. Thus, the enhanced longevity and proclivity of intense TCs dominate in so-called active years, which contribute considerable ACE, are the result of genesis location shifts and the beneficial prevailing environmental conditions such as weakened vertical shear modulated by large-scale climate variability.
p. 207The structure of the Pacific correlation pattern of SST with NH ACE suggests that considerable predictive information for the upcoming NH TC year is present in boreal spring. Furthermore, when acknowledging the role of ENSO in modulating WPAC+EPAC TC ACE, winter midlatitude storm activity imprinting upon boreal spring NP SST, and the interrelated basin climatology described above, NATL ACE activity falls out as a residual of the NH minus WPAC+EPAC ACE total. This suggests an additional null hypothesis to the NATL global warming and hurricanes puzzle: the NATL increase in activity since 1995 is part of large-scale hemispheric climate variability with clear association to the EPAC against a backdrop of local and relative NATL tropical SST increases.
To understand the evolution of TCs in a future climate, an adequate understanding of the mechanisms controlling current and past TC activity is critical to identifying exactly what features of climate will indeed change, especially in the Pacific basin (Vecchi and Soden 2007a; Vecchi et al. 2008). The evolution of NP SST signals may provide a fruitful area for further research into climate modulation of global TC variability.” Recent findings from Shakun and Shaman (2009) show that the Pacific Decadal Variability (PDV) on either side of the equator is strongly similar suggesting that the Pacific Decadal Oscillation (PDO) may be best viewed as a reddened response to ENSO. Furthermore, Shakun and Shaman (2009) postulate that PDV is a basin-wide phenomena driven from the tropics into both hemispheres. Thus, there may be significant implications for the relationship between PDV and the PDO in general with global TC ACE or other metrics of TC activity.
#7.7 Recent tropical cyclone ACE and future research focus
Future research will continue to monitor global ACE in real-time as cyclones develop throughout the year. As of March 2010, global and Northern Hemisphere TC ACE levels are near their lowest levels in 30-years when calculated on a 24-month running sum time scale (Figure 7.18). A 24-month running sum is chosen to include the Southern Hemisphere TC season which straddles the calendar from October to April, and is reflective of recent activity on the time-scale closer to ENSO (~2-7 years). The low-levels of TC ACE are indicative of a recent spate of low-ACE TCs or those with low maximum intensities and shorter durations often forming near to land or immediately disrupted by unfavorable atmospheric conditions. Thus, the investigation of ACE-per-storm is a priority in order to validate the conclusions of Elsner et al. (2008). Based upon the objective satellite reanalysis of Kossin et al. (2007), Elsner et al. concluded through the use of quantile regression that the most intense global TCs are indeed getting stronger. However, no explanation was provided in terms of large-scale climate modulators that may be responsible for affecting maximum TC intensity. Questions about the quality of the data also remain.
Figure 7.18: Global and Northern Hemisphere TC ACE from the best track dataset, 24-month running sums (units x104 kts2) updated through June 30, 2010. p. 235
It is advantageous in many research situations to have homogeneous and accurate data, and TC intensity estimates are no exception. After the Emanuel (2005) and Webster et al. (2005) high-profile papers in Nature and Science, several comments resulted (e.g. Landsea et al. 2006; Chan 2005) questioning the suitability of best-track records being used for climate purposes in addition to methodology concerns using that data. These studies among others only utilized NHC and JTWC best-tracks while ignoring data from the rest of the world’s Regional Specialized Meteorological Centres (RMSC) and TC Warning Centers such as Tokyo, Australia, and Reunion. The International Best Track Archive for Climate Stewardship (IBTrACS) project was initiated in order to accumulate the world’s TC data in one handy location (Knapp et al. 2010; Levinson et al. 2010; Kruk et al. 2009). While we recognize that there are significant differences in many TC intensity estimates especially when comparing Typhoon maximum wind speeds, consider reanalysis of the historical record must be conducted prior to ascribing certainty bounds on the accuracy of the best-track data (e.g. Kossin et al. 2007). The IBTrACS dataset will be an invaluable resource for determining which TCs should receive added attention and focus with regards to intensity reanalysis.
#7.7.1 Northern and Southern Hemisphere ACE-per-storm
p. 208As a cursory result of research to be presented at the 2010 AMS Tropical Conference, Figure 7.19 (top) depicts the ACE-per-storm as a function of the maximum attained wind speed for each NH TC from 1979-2009, which includes 1831 individual storms that reach at least 34-knots once during their lifecycle. The following statistics are gleaned from this ACE-per-storm dataset:
Figure 7.19: ACE distribution per storm 1979-2009 for the [top/bottom] [Northern/Southern] Hemisphere (y axis) as a function of maximum wind speed attained (x axis, knots). The shadings denote individual bins of size 0.5 ACE units by 5 knots wind speed. The numbers inside the plot area identify the population in each wind speed bin. p. 236
The total ACE during the 31-years is 17570 units (one ACE unit is 104 kts2) and the average Northern Hemisphere ACE per year is 560 with considerable variability. The average ACE per storm is 9.5.
797 TCs or 44% do not reach hurricane strength (> 64 knots)
527 (507) TCs reach maximum intensities of 64-95 (100+) knots or non-major (major) status on the Saffir-Simpson scale
The median ACE value is 4.86 and the 917 TCs below this value contain only 10% of the historical ACE collectively.
At the other extreme, the highest 278 or only 15% of TC ACE-per-storm out of the total account for fully 50% of the historical ACE during the past 31-years. This involves TCs with an ACE-per-storm of greater than 20.
Of the TCs that obtain an ACE of greater than 20, the average (median) maximum intensity attained is 128.5 (130) knots or strong Category 4.
Category 3+ TCs or those that reach at least 100 knots (n=507) have an average ACE of 23.3 with a sigma of 11.5 and account for 68% of historical ACE collectively during the past 31-years.
The previous calculation for Category 4+ TCs or those that reach at least 115 knots (n=352) account for 54% of historical ACE.
Hurricane Ioke (2006) holds the current record for most ACE of 86 due to its very long track through the Pacific Ocean at major hurricane status or higher. Figure 7.20 highlights the long track of Ioke. There are similar TCs that complete a trans-Pacific track beginning in the EPAC and end in the WPAC including Paka (1997) and John (1994).
Figure 7.20: Track of Hurricane Ioke (2006) with inset of MODIS image onboard TERRA satellite on August 24, 2006 at 21:55 UTC obtained from http://earthobservatory.nasa.gov/ NaturalHazards/view.php?id=17243&oldid=13811. p. 237
The step increase in North Atlantic hurricane activity is easily noticeable across a wide variety of metrics. When separated in two periods of 1979-1994 and 1995-2009, there are significant differences between ACE per storm and frequency. The first period has 141 out of a total of 354 storms or 40% of the 31-year total and 35% of the overall ACE. The average ACE-per-storm is 8 (10) during the first (second) period. Indeed, 50 (102) Atlantic hurricanes account for 50% (75%) of the ACE during the past 31-years, which is reflective of the vast range of storms in the basin. Some are very weak and short-duration, while others are impressive Cape Verde Category 5 monsters. The median Atlantic storm ACE is 3.8. The range extended from 0.1225, which is one 35-knot wind speed observation for 6-hours to 70.38 for Hurricane Ivan (2004). Thus, the usage of a frequency metric may not be appropriate for all climate applications. Landsea et al. (2010) investigated the increasing frequency of very short-lived storms in the NATL and found that technological advancements such as QuikSCAT may have contributed to TC detection during the past decade.
p. 209With the increase in the North Atlantic, a concomitant decrease has occurred in the North Eastern Pacific (EPAC). Again, separating the two basins sums into two periods before and after 1995 yields a significant difference in TC metrics. Of the 501 storms during the 1979-2009 period, 293 occur prior to 1995 and 208 afterwards. 60% of the period's ACE occurred during the first 16-years. When the EPAC and NATL are treated as one extended basin, the overall trend in seasonal ACE vanishes as the two-step changes cancel out. Recently, Kossin et al. (2010) used a clustering methodology of NATL storm tracks and found a shift toward proportionally more deep tropical systems rather than baroclinic induced systems in the early- to mid-1980s. A reasonable avenue of future research would involve relating these track changes to more El Nino's rather than La Nina's and a positive Pacific Decadal Oscillation Index since the late 1970s and early 1980s and relating the EPAC track changes (if any) with the NATL.
The change in behavior of the North Atlantic between 1994 and 1995 has been discussed by several studies (e.g. Goldenberg et al. 2001). A brief discussion is motivated by the large disparity in TC ACE during each July - October period in 1994 and 1995 in the Northern Hemisphere. The EPAC (NATL) ACE dropped (increased) from 180 (13) to 100 (241) while the WPAC fell from 361 to 210. Overall, the NH saw similar overall activity with the basins compensating for each other in terms of ACE. A reasonable hypothesis is thus posited: does activity in one basin inhibit or contribute to activity in another. Through what large scale climate mechanisms would this take place? The most apparent change between 1994 and 1995 was the transition from the strong, extended El Nino period of 1990-1995 (Trenberth and Hoar 1997) to a rather weak La Nina. Goldenberg et al. report on possible changes in the behavior of African Easterly Wave development due to local thermodynamic factors such as SSTs as well as longer-term multidecadal variations attributed to the Atlantic Multidecadal Oscillation (AMO). Considerable debate has continued during the past 10-years about the reality of such an AMO, but that is beyond the scope of this dissertation.
This avenue of research is motivated from the considerable variability in TC lifecycle properties across the global basins. It is true that stronger TCs in terms of maximum intensity attain higher ACE but also see more variability in that metric. The Southern Hemisphere ACE-per-storm is shown for comparison purposes (Figure 7.19 bottom). The population of SH storms from November 1978 through April 2009 is 793 TCs that exceed 34 knots maximum sustained one-minute winds according to the archived JTWC Best-Track TC data. It should be noted that there are many missing storms in the best-track database and this data is not considered of sufficient quality to deduce long-term trends. SH storms tend to be fewer in frequency than their NH cousins but can be just as intense and long-lasting especially in the Southern Indian and Southwest Pacific basins. Here are some statistics similar to the NH presented above, keeping in mind the data quality issues:
p. 210During the past 30-years, SH ACE has totaled 6235 units spread over 793 storms for an average of 7.9 ACE per storm, which is less than the NH. The median value of ACE is 4.3, also slightly less than the NH.
A total of 58 TCs have exceeded an ACE of 24 and are plotted in Figure 7.21. The majority of the strongest storms occur in the Southern Indian Ocean with fewer near Australia and in the South Pacific. Storm number 58 with an ACE of 24.0875 was Hamish from March 2009 off the coast of NE Australia. Its maximum sustained 1-minute winds were 135 knots. The average year of occurrence is 1996 for these top 58 TCs.
The SH storms with the most ACE including the season of occurrence are Ingrid (04-05; 47), Hudah (99-00; 45), Alibera (89-90; 45), Helinda/Pancho (96-97; 42), Elinor (82-83; 41), Litanne (93-94; 40).
In terms of maximum intensity, there have been 19 storms since 1979 that have attained Category 5 status or greater than 135 knots. 7 TCs came close at 135 knots, 15 more at 130 knots, and 22 others at 125 knots; all powerful storms in their own right. The most intense wind speed estimated belongs to Monica near Australia (Figure 7.22a at maximum intensity April 24, 2006) and Zoe in the Southwest Pacific Ocean (Figure 7.22b at maximum intensity December 28, 2002) each at 155 knots, respectively.
Figure 7.21: Tracks of Southern Hemisphere tropical cyclones that exceed an ACE of 24 (n=58). p. 238Figure 7.22: (a) Tropical Cyclone Monica MODIS image on board AQUA on April 24, 2006 at 04:30 UTC obtained from http://earthobservatory.nasa.gov/NaturalHazards/view.php ?id=16456&oldid=13519 (b) Tropical Cyclone Zoe from MODIS located just northeast of Vanuatu in the South Pacific Ocean on December 28, 2002 at 22:55 UTC obtained from http://visibleearth.nasa.gov/view_rec.php?id=4854. p. 239
Exploration of the large-scale climate modulating effects on TC tracks, intensity, and frequency has picked up stream during the past several years with recent studies demonstrating connections. Additional research is underway to ascertain the climate modulations responsible for interannual variations of this ACE-per-storm distribution (e.g. Maue 2010).
#7.7.2 Recent global downturn in tropical cyclone activity
It is critical to understand the large-scale climate modulations responsible for the dramatic reduction in global TC activity during the past three-years. Figure 5.18 shows the time series of global and NH TC ACE from 1979-2010 on 24-month time scales or running sums. The top series is the global total while the bottom is the NH portion with the difference or shaded region representing the Southern Hemisphere contribution. Just as the 1990s represented a period of increased ACE, the most recent several years are characterized by depressed activity. Nevertheless, during this depressed period, there are spurts of TC activity occurring in multiples across the basins of the NH, for example. During the past 376 months from Jan 1979 to Feb 2010, there are many months that have no ACE recorded, and this is expected during much of the cold season.
72 months recorded no ACE and 130 recorded less than an ACE of 10. Thus, 1/3 of the months during the past 31 years have not seen TC activity, especially during the winter months.
The most prolific month of TC ACE activity for the NH is September, when SSTs and atmospheric conditions are the most conducive for frequent, long-lasting, and intense TCs. The top 8 of 10 months overall from 1979-2009 are Septembers (2003, 1987, 1997, 1995, 1996, 1992, 2005, 2004), respectively.
During 2007 to early 2009, the Earth's climate has cooled under the effects of a dramatic La Nina episode (and possible solar-cycle minimums e.g. Lockwood et al. 2010). During La Nina warm seasons, the Pacific Ocean basin typically sees much weaker TCs that indeed have shorter lifecycles and therefore less-ACE (Table 7.4). Conversely, due to well-researched upper-atmospheric flow (i.e. vertical shear) configurations favorable to Atlantic hurricane development and intensification (Gray 1984), La Nina falls tend to favor very active seasons in the Atlantic (El Nino years are the converse, with must less activity, as forecast by Gray and NOAA for 2009). Thus, the WPAC and EPAC tropical activity was well below normal in 2007 and 2008 (Table 7.5-7.6). The Southern Hemisphere (SH), which includes the southern Indian Ocean from the coast of Mozambique across Madagascar to the coast of Australia, into the South Pacific and Coral Sea, saw below normal activity as well in 2008. During the 2008-2009 TC season, the SH ACE was about half of what is expected in a normal year, with a multitude of very weak, short-lived TCs. All of these numbers tell an intriguing story: just as there are active periods of TC activity around the globe, there are inactive periods, and the period from 2007-2010 is currently one of the most impressive inactive periods during the past several decades. The causes and implications of this record inactive period are important to understand in terms of correctly describing the natural variability in the climate system prior to ascribing anthropogenic influences.
Table 7.4: ACE statistics during the months of July – December for 2007-2009 for the Northern Hemisphere as a whole (including the Northern Indian, Western North Pacific, Eastern North Pacific, and the North Atlantic basins).
2009
2008
2007
July
16
85
33
August
126
57
110
September
84
136
85
October
144
39
51
November
54
17
55
December
5
10
1
Totals for July-Dec
428
345
335
Table 7.5: Accumulated Cyclone Energy (ACE) for the years 2007-2009 for the Northern Hemisphere tropical cyclone basins. Calendar year values are reported.
2009
2008
2007
Eastern Pacific
128
82
53
North Atlantic
52
144
72
WPAC + NIO
281
204
261
Total NH
461
431
386
p. 211The preceding research describes the need for more accurate TC intensity data going forward including information about size as well as wind speed. As reanalysis datasets improve along with the data assimilation techniques used to process satellite data, one can expect better model representations of TC structure, which will enable the Power Dissipation Index as well as the Accumulated Cyclone Energy index to be adequately tested as true measures of a TC's role in climate.
Also in this chapter
Table 7.6: 30-year climatological ACE averages (1979-2008) for the basins of the Northern Hemisphere for the months of July – October. For the NH overall, the July-October average is 430.
July
August
September
October
Eastern Pacific
28
34
37
18
North Atlantic
7
26
52
14
WPAC + NIO
35
57
65
59
Total NH
69
117
154
90
References
71 of the dissertation’s 282 references, those cited in the sections above, as listed in the dissertation.
Alexander, M.A., I. Blade, M. Newman, J.R. Lazante, N. Lau, and J.D. Scott, 2002: The Atmospheric Bridge: The influence of ENSO teleconnections on air-sea interaction over the global oceans. J. Climate, 15, 2205-2231.
Bell, G.D., and co-authors, 2000: The 1999 North Atlantic Hurricane Season: A Climate Perspective. State of the Climate in 1999. Bull. Amer. Meteor. Soc., 81, S1-S68.
Camargo, S.J., and A.H. Sobel, 2005: Western North Pacific TC intensity and ENSO. J. Climate, 18, 2996-3006.
Camargo, S.J., K.A. Emanuel, and A.H. Sobel, 2007: Use of a genesis potential index to diagnose ENSO effects on TC genesis. J. Climate, 20, 4819-4834.
Camargo, S.J., A.W. Robertson, S.J. Gaffney, P. Smyth, and M. Ghil, 2007: Cluster Analysis of Typhoon Tracks. Part I: General Properties. J. Climate, 20, 3635–3653.
Camargo, S.J., A.W. Robertson, S.J. Gaffney, P. Smyth, and M. Ghil, 2007: Cluster Analysis of Typhoon Tracks. Part II: Large-Scale Circulation and ENSO. J. Climate, 20, 3654–3676.
Chan, J.C.L., 1985: TC activity in the northwest Pacific in relation to the El Niño/Southern Oscillation phenomenon. Mon. Wea. Rev., 113, 599–606.
Chan, J.C.L., and K.S. Liu, 2004: Global warming and western north Pacific typhoon activity from an observational perspective. J. Climate, 17, 4590-4602.
Dean, L., K.A. Emanuel, and D.R. Chavas, 2009: On the size distribution of Atlantic tropical cyclones. Geophys. Res. Lett., 36, L14803, doi:10.1029/2009GL039051.
Demuth, J., M. DeMaria, and J.A. Knaff, 2006: Improvement of advanced microwave sounder unit tropical cyclone intensity and size estimation algorithms. J. Appl. Meteor., 45, 15731581.
Elsner, J.B., and A.B. Kara, 1999: Hurricanes of the North Atlantic: Climate and Society. Oxford University Press, 488 pp.
Elsner, J.B., J.P. Kossin, and T.H. Jagger, 2008: The increasing intensity of the strongest tropical cyclones. Nature, 455, 92-95.
Emanuel, K.A., 1988: The maximum potential intensity of hurricanes. J. Atmos. Sci., 45, 11431155.
Emanuel, K.A., 2005: Increasing destructiveness of tropical cyclones over the past 30 years. Nature, 436, 686-688.
Emanuel, K.A., R. Sundararajan, and J. Williams, 2008: Hurricanes and global warming: Results from downscaling IPCC AR4 simulations. Bull. Amer. Meteor. Soc,, 89, 347-367.
Ferreira, R.N., W.H. Schubert, and J.J. Hack, 1996: Dynamical aspects of twin TCs associated with the Madden-Julian oscillation. J. Atmos. Sci., 53, 929-945.
Frank, W.M., and G.S. Young, 2007: The interannual variability of TCs. Mon. Wea. Rev., 135, 3587-3598.
Fritz, A.M., 2009: North Atlantic tropical cyclones: a kinetic energy perspective. Masters Thesis., 53pp.
Goldenberg, S.B., C.W. Landsea, A.M. Mestas-Nuñez, and W.M. Gray, 2001: The recent increase in Atlantic hurricane activity: Causes and implications. Science, 293, 474–479.
Graham, N.E., and T.P. Barnett, 1987: Sea surface temperature, surface wind divergence, and convection over tropical oceans. Science, 238, 657–659.
Gray, W.M., 1984: Atlantic seasonal hurricane frequency. Part I: El Niño and 30 mb quasibiennial oscillation influences. Mon. Wea. Rev., 112, 1649-1668.
Harr, P.A., and R.L. Elsberry, 2000: Extratropical Transition of Tropical Cyclones over the Western North Pacific. Part I: Evolution of Structural Characteristics during the Transition Process. Mon. Wea. Rev., 128, 2613–2633.
Harr, P.A., and J.M. Dea, 2009: Downstream development associated with the extratropical transition of tropical cyclones over the Western North Pacific. Mon. Wea. Rev., 137, 1295–1319.
Hart, R.E., and R.H. Grumm, 2001: Using Normalized Climatological Anomalies to Rank Synoptic-Scale Events Objectively. Mon. Wea. Rev., 129, 2426–2442.
Hart, R.E., and J.L. Evans, 2001: A climatology of the extratropical transition of Atlantic tropical cyclones. J. Climate, 14, 546–564.
Hart, R.E., 2003: A cyclone phase space derived from thermal wind and thermal asymmetry. Mon. Wea. Rev., 131, 585–616.
Hart, R.E., and J. L Evans, 2003: A climatology of the extratropical transition of Atlantic tropical cyclones. J. Climate, 14, 546-564.
Hart, R.E., J.L. Evans, and C. Evans, 2006: Synoptic composites of the extratropical transition life cycle of North Atlantic tropical cyclones: Factors determining posttransition Evolution. Mon. Wea. Rev., 134, 553–578.
Hart, R.E., R.N. Maue, and M. Watson, 2007: Estimating the local memory of TCs through MPI anomaly evolution. Mon. Wea. Rev., 135, 3990-4005.
Karl, T.R. et al. (eds) Weather and Climate Extremes in a Changing Climate. Regions of Focus: North America, Hawaii, Caribbean, and US Pacific Islands. (US Climate Change Science Program and Subcommittee on Global Change Research, Department of Commerce, NOAA National Climatic Data Center, 2008). Kelly, G., J.-N. Thepaut, R. Buizza, and C. Cardinali, 2007: The value of observations. I: Data denial experiments for the Atlantic and the Pacific. Quart. J. Roy. Meteor. Soc., 133, 1803-1815.
Knapp, K.R., M.C. Kruk, D.H. Levinson, H.J. Diamond, and C.J. Neumann, 2010: The International Best Track Archive for Climate Stewardship (IBTrACS): Unifying tropical cyclone best track data. Bull. Amer. Meteor. Soc.: (in press).
Knutson, T.R., J.J. Sirutis, S.T. Garner, G.A. Vecchi, and I. Held, 2008: Simulated reduction in Atlantic hurricane frequency under twenty-first-century warming conditions. Nature Geoscience, 1(6), 359-364.
Kossin, J.P., and D.J. Vimont, 2007: A more general framework for understanding Atlantic hurricane variability and trends. Bull. Amer. Meteor. Soc., 88, 1767-1781.
Kossin, J.P., K.R. Knapp, D.J. Vimont, R.J. Murnane, and B.A. Harper, 2007: A globally consistent reanalysis of hurricane variability and trends. Geophys. Res. Lett., 34, L04815, DOI:10.1029/2006GL028836.
Kossin, J.P., and S.J. Camargo, 2009: Hurricane track variability and secular potential intensity trends. Climatic Change, 97,329-337, DOI:10.1007/s10584-009-9748-2.
Kossin, J.P., S.J. Camargo, and M. Sitkowski, 2010: Climate modulation of North Atlantic hurricane tracks. J. Climate, (in press).
Knutson, T.R., et al. 2010: Tropical cyclones and climate change. Nature Geoscience. 3, 157163.
Kruk, M.C., K.R. Knapp, and D.H. Levinson, 2009: A technique for combining global tropical cyclone best track data. J. Atmos, Oceanic Technol., 27, 680-692.
Lander, M.A., 1994: An exploratory analysis of the relationship between tropical storm formation in the western North Pacific and ENSO. Mon. Wea. Rev., 122, 636–651.
Lander, M.A., and C.P. Guard, 2001: Western North Pacific, NIO, and SH TCs of 1997. Mon. Wea. Rev., 129, 3015-3036.
Landsea, C.W., B.A. Harper, K. Hoarau, and J.A. Knaff, 2006: Can we detect trends in extreme tropical cyclones? Science, 313, 452-454.
Li, C., 1988: Actions of typhoons over the western Pacific (including the South China Sea) and El Niño. Adv. Atmos. Sci., 5, 107–115. Lim, E-P., and I. Simmonds, 2002: Explosive cyclone development in the southern hemisphere and a comparison with northern hemisphere events. Mon. Wea. Rev., 130, 2188-2209.
Lockwood, M., R.G. Harrison, T. Woollings, and S.K. Solanki, 2010: Are cold winters in Europe associated with low solar activity? Environ. Res. Lett., 5, 1-7. Loptien U. and E. Ruprecht, 2005: Effect of synoptic systems on the variability of the North Atlantic Oscillation. Mon. Wea. Rev., 133, 2894 – 2904.
Manning, D. and R.E. Hart, 2007: Evolution of North Atlantic ERA40 Tropical Cyclone Representation. Geophys. Res. Lett., 34, L05705. doi:10.1029/2006GL028266
Maue, R.N. and R.E. Hart, 2007: Comment on: "Low frequency variability in globally integrated tropical cyclone power dissipation." Geophys. Res. Lett., 34, L11703, doi:1029/2006GL028283
Maue, R.N., and R.E. Hart, 2007: Midlatitude-tropical intrusions and extrusions: territory invasion. 22nd Conference on Weather Analysis and Forecasting. Park City, Utah.
Maue, R.N., R.E Hart, and M.A. Bourassa, 2008: Tropical cyclone trends and attribution from reanalysis datasets. Proceedings of the Tropical Meteorology Special Symposium. New Orleans, LA.
Maue, R.N., 2009: Initial Condition Sensitivity Associated with Low Predictability Flow Regimes. National Research Council Research Associateship Proposal.
Maue, R.N., 2010: Recent decline in global tropical cyclone activity: Causes and implications. (in preparation).
McTaggart-Cowan, R., L.F. Bosart, J.R. Gyakum, and E.H. Atallah, 2007: "Hurricane Katrina (2005). Part I: Complex Lifecycle of an Intense Tropical Cyclone. Mon. Wea. Rev., 135, 3905–3926.
McTaggart-Cowan, R., L.F. Bosart, J.R. Gyakum, and E.H. Atallah, 2007: "Hurricane Katrina (2005). Part II: Evolution and Hemispheric Impacts of a Diabatically Generated Warm Pool. Mon. Wea. Rev., 135, 3927-3949.
Orlanski, I., and J. Sheldon, 1995: Stages in the energetics of baroclinic systems. Tellus, 47A, 605-628.
Powell, M.D., S.H. Houston, L.R. Amat, and N. Morisseau-Leroy, 1998: The HRD real-time surface wind analysis system. J. Wind Eng. Indust. Aerodyn., 77-78, 53-64.
Ramsay, H.A., et al., 2008: Interannual variability of TCs in the Australian region: Role of large-scale environment. J. Climate, 21, 1083- 1103.
Rappaport, E.N. et al. 2009: Advances and challenges at the National Hurricane Center. Wea. Forecasting, 24, 395-419.
Rayner, N.A., et al., 2007: Global analyses of sea surface temperature, sea ice, and night marine air temperature since the late nineteenth century. J. Geophys. Res., 108, 235-247.
Shakun, J.D. and J. Shaman, 2009: Tropical Origins of North and South Pacific Decadal Variability. Geophys. Res. Lett., 36, L19711, doi:10.1029/2009GL040313.
Shapiro, M.A. and D. Keyser, 1990: Fronts, Jet Streams, and the Tropopause. Extratropical Cyclones: The Erik Palmen Memorial Volume, eds.: C.W. Newton and E.O. Holopainen, Amer. Met. Soc., Boston, 167-191.
Solomon, S. et al., 2007: IPCC Climate Change 2007: The Physical Science Basis. Cambridge University Press.
Sriver, R., and M. Huber (2006), Low frequency variability in globally integrated tropical cyclone power dissipation, Geophys. Res. Lett., 33, L11705, doi:10.1029/ 2006GL026167
Sriver, R.L., and M. Huber, 2007: Reply to comment by R.N. Maue and R.E. Hart on “Low frequency variability in globally integrated tropical cyclone power dissipation”, Geophys. Res. Lett., 34, L11704, doi:10.1029/2007GL029413.
Swanson, K.L., and P.J. Roebber, 2008: The impact of analysis error on medium-range weather forecasts. Mon. Wea. Rev., 136, 3425-3431.
Trenberth, K.E., and T.J. Hoar (1997), El Niño and climate change, Geophys. Res. Lett., 24(23), 3057–3060.
Vecchi, G.A., and B.J. Soden (2007). Increased Tropical Atlantic Wind Shear in Model Projections of Global Warming, Geophys. Res. Lett., 34, L08702, doi:10.1029/2006GL028905.
Velden, C., et al. 2006: The Dvorak tropical cyclone intensity estimation technique: a satellite based method that has endured for over 30 years. Bull. Amer. Meteor. Soc., 87, 11951210.
Webster, P.J., G.J. Holland, J.A. Curry, and H-R. Chang, 2005: Changes in tropical cyclone number, duration and intensity in a warming environment. Science, 309, 1844-1846.
Wu, M. C., and N.-C. Lau, 1992: A GCM simulation of the relationship between tropical-storm formation and ENSO. Mon. Wea. Rev., 120, 958-977.
Yu, J.-Y.,C. Chou, and P.-G. Chiu, 2009: A revised accumulated cyclone energy index. Geophys. Res. Lett., 36, L14710, doi:10.1029/2009GL039254.
Part II
Research since 2010
Fifteen years of work on the questions Chapter 7 left open. Each paper links to its DOI (all verified
against Crossref), with a one-line summary and, where it applies, a note on how it updates the 2010 text.
Editor’s notes on the 2010 text
Equation 7.4
As printed, Eq. 7.4 writes the outer term as R/β (roβ − Rβ) and leaves out ρ. Integrating a modified Rankine vortex (V = Vmaxr/R inside R, Vmax (R/r)α outside) gives PD = 2πρCDV3R2[((ro/R)β − 1)/β + 1/5], which is equivalent to the printed form with R−β in place of R. climatlas implements this consistent form (and the matching IKE) alongside its 2-D wind field. The text above is left exactly as published.
The Ivan (2004) check, reproduced
§7.4 reports a mean wind of 51.7 kt inside Ivan's 34-kt radius at 0130 UTC 13 September 2004 from H*Wind. climatlas's radii-constrained 2-D wind field, built only from the Extended Best Track, gives 51.8 kt at 0000 UTC and 51.9 kt at 0600 UTC.
Global tropical cyclone activity after the 2007–2010 low
§7.5–7.7
The dissertation ended in the middle of a global lull in accumulated cyclone energy. Fifteen years on, that lull reads as the deep end of Pacific-driven decadal swings. It was not the start of a secular decline, and the long global ACE record still shows no trend.
Maue, R.(2011). Recent historically low global tropical cyclone activity. Geophysical Research Letters, 38. doi:10.1029/2011GL047711
The peer-reviewed version of §7.7: global and Northern Hemisphere ACE in 2007–2010 fell to the lowest levels since the 1970s, with La Niña and the cool PDO phase explaining much of the drop.
2010 linkDirect publication of the Chapter 7 result.
Klotzbach, P. & Landsea, C.(2015). Extremely Intense Hurricanes: Revisiting Webster et al. (2005) after 10 Years. Journal of Climate, 28, 7621-7629. doi:10.1175/JCLI-D-15-0188.1
Ten years after Webster et al. (2005), the global count of Category 4–5 storms showed no significant change over 1990–2014. The earlier rise came mostly from better observations between 1970 and 1990.
2010 linkSupports the chapter's warning that uneven best-track records can produce spurious trends.
Klotzbach, P., Wood, K., et al.(2022). Trends in Global Tropical Cyclone Activity: 1990–2021. Geophysical Research Letters, 49, e2021GL095774. doi:10.1029/2021GL095774
For 1990–2021, global hurricane counts and ACE declined significantly, mostly in the western North Pacific. The authors tie this to a more La Niña-like Pacific. Short-lived storms and rapid intensification increased.
2010 linkExtends the ENSO control on global ACE described in §7.5 to a 32-year trend.
Shan, K., Song, F., et al.(2025). How does globally accumulated tropical cyclone energy vary in response to a changing climate?. Science Bulletin, 70, 943-950. doi:10.1016/j.scib.2024.12.036
Global ACE has large decadal swings, peaking in the 1990s, that track the Interdecadal Pacific Oscillation (r ≈ 0.75).
2010 linkPlaces the 2007–2009 minimum in its decadal context.
Manatsa, D. & Mushore, T.(2026). Antiphase Atlantic–Pacific covariability in tropical cyclone accumulated energy associated with AMO and ENSO, with no detected trend in the global total, 1980–2025. Climate Dynamics, 64, 398. doi:10.1007/s00382-026-08362-2
Summed six-basin ACE shows no detectable trend over 1980–2025. The North Atlantic and the Pacific move in antiphase: the Atlantic share is rising while the western North Pacific share is falling.
2010 linkThe newest update of the basin-compensation argument in §7.5.1 and §7.6.
Chand, S., Walsh, K., et al.(2022). Declining tropical cyclone frequency under global warming. Nature Climate Change, 12, 655-661. doi:10.1038/s41558-022-01388-4
Reconstructed annual storm counts declined over the 20th century, by about 13% globally, linked to a weaker large-scale circulation.
Kossin, J., Knapp, K., Olander, T., & Velden, C.(2020). Global increase in major tropical cyclone exceedance probability over the past four decades. Proceedings of the National Academy of Sciences, 117, 11975-11980. doi:10.1073/pnas.1920849117
In the homogeneous ADT-HURSAT satellite record (1979–2017), the chance that a storm reaches major intensity rose by about 8% per decade.
2010 linkOne answer to the chapter's heterogeneity problem: rebuild intensities uniformly from satellites.
Kossin, J., Emanuel, K., & Vecchi, G.(2014). The poleward migration of the location of tropical cyclone maximum intensity. Nature, 509, 349-352. doi:10.1038/nature13278
The latitude where storms reach peak intensity has moved poleward by roughly 50–60 km per decade in both hemispheres.
Murakami, H., Delworth, T., et al.(2020). Detected climatic change in global distribution of tropical cyclones. Proceedings of the National Academy of Sciences, 117, 10706-10714. doi:10.1073/pnas.1922500117
The 1980–2018 changes in where storms occur are partly attributable to human forcing: fewer storms in the south Indian Ocean and western North Pacific, more in the North Atlantic and central Pacific.
Vecchi, G., Landsea, C., et al.(2021). Changes in Atlantic major hurricane frequency since the late-19th century. Nature Communications, 12, 4054. doi:10.1038/s41467-021-24268-5
After adjusting for storms missed in the early record, Atlantic major-hurricane frequency shows no significant century-scale rise. The recent increase looks partly like recovery from a 1960s–80s low.
2010 linkPuts numbers on the undercounting concern raised in §7.1 and §7.7.
Emanuel, K.(2021). Atlantic tropical cyclones downscaled from climate reanalyses show increasing activity over past 150 years. Nature Communications, 12, 7027. doi:10.1038/s41467-021-27364-8
Downscaling climate reanalyses instead suggests Atlantic activity has risen since the 1800s. The reconstruction question is still open.
Bhatia, K., Vecchi, G., et al.(2019). Recent increases in tropical cyclone intensification rates. Nature Communications, 10, 635. doi:10.1038/s41467-019-08471-z
Atlantic intensification rates in 1982–2009 rose more than natural variability alone can explain.
Kossin, J.(2018). A global slowdown of tropical-cyclone translation speed. Nature, 558, 104-107. doi:10.1038/s41586-018-0158-3
Reported a ~10% global slowdown in storm translation speed since 1949. Later work questioned whether this reflects changes in the observing record.
2010 linkRelevant to the duration component that dominates integrated ACE and PDI (§7.2).
Assessments after Knutson et al. (2010)
§7.1
The consensus process that Chapter 7 opens with has continued.
Knutson, T., Camargo, S., et al.(2019). Tropical Cyclones and Climate Change Assessment: Part I: Detection and Attribution. Bulletin of the American Meteorological Society, 100, 1987-2007. doi:10.1175/BAMS-D-18-0189.1
Detection and attribution: confidence is still low to medium that most tropical cyclone metrics have changed detectably. The poleward migration in the western North Pacific is among the better-supported signals.
2010 linkDirect successor to the Knutson et al. (2010) review discussed in §7.1.
Knutson, T., Camargo, S., et al.(2020). Tropical Cyclones and Climate Change Assessment: Part II: Projected Response to Anthropogenic Warming. Bulletin of the American Meteorological Society, 101, E303-E322. doi:10.1175/BAMS-D-18-0194.1
Projections at 2 °C of warming: higher lifetime maximum intensity, a larger share of Category 4–5 storms, more rainfall near the storm, and somewhat fewer storms overall.
IPCC (Seneviratne, S. I., et al.)(2023). Weather and Climate Extreme Events in a Changing Climate. Climate Change 2021 – The Physical Science Basis, 1513-1766. doi:10.1017/9781009157896.013
IPCC AR6 (Chapter 11): the global share of Category 3–5 storms has likely increased over four decades. Long-term trends in storm frequency carry low confidence.
2010 linkThe AR6 counterpart to the AR4 statement quoted in §7.1.
Sobel, A., Wing, A., et al.(2021). Tropical Cyclone Frequency. Earth's Future, 9, e2021EF002275. doi:10.1029/2021EF002275
A review of why the Earth has roughly the number of tropical cyclones it does, and why models disagree on how that number will change.
2010 linkPicks up the "80–90 storms a year" question quoted in §7.6.2.
Energy metrics: ACE, PDI, IKE and true power dissipation
§7.2–7.4
The 2010 argument was that peak-wind indices (ACE, PDI) need the size of the wind field to measure a storm's energy. Since then, integrated kinetic energy (IKE) has become a standard metric, and the damage literature has sharpened which measures matter.
Villarini, G. & Vecchi, G.(2012). North Atlantic Power Dissipation Index (PDI) and Accumulated Cyclone Energy (ACE): Statistical Modeling and Sensitivity to Sea Surface Temperature Changes. Journal of Climate, 25, 625-637. doi:10.1175/JCLI-D-11-00146.1
North Atlantic PDI and ACE are well modeled by tropical Atlantic SST relative to the tropical mean. With that relative SST, projected increases are modest.
2010 linkRevisits the case for PDI as a warming index discussed in §7.1–7.2.
Misra, V., DiNapoli, S., & Powell, M.(2013). The Track Integrated Kinetic Energy of Atlantic Tropical Cyclones. Monthly Weather Review, 141, 2383-2389. doi:10.1175/MWR-D-12-00349.1
Defines track-integrated kinetic energy (TIKE), IKE summed over a storm's life: ACE with size built in.
2010 linkEssentially the size-aware seasonal metric §7.4 called for.
Kozar, M. & Misra, V.(2014). Statistical Prediction of Integrated Kinetic Energy in North Atlantic Tropical Cyclones. Monthly Weather Review, 142, 4646-4657. doi:10.1175/MWR-D-14-00117.1
SPIKE: a statistical model that forecasts Atlantic IKE out to 72 hours.
Klotzbach, P., Bell, M., et al.(2020). Surface Pressure a More Skillful Predictor of Normalized Hurricane Damage than Maximum Sustained Wind. Bulletin of the American Meteorological Society, 101, E830-E846. doi:10.1175/BAMS-D-19-0062.1
Minimum central pressure predicts normalized U.S. hurricane damage better than maximum sustained wind.
Klotzbach, P., Chavas, D., et al.(2022). Characterizing Continental US Hurricane Risk: Which Intensity Metric Is Best?. Journal of Geophysical Research: Atmospheres, 127, e2022JD037030. doi:10.1029/2022JD037030
For continental U.S. landfalls (1988–2021), central pressure ranked best against damage (r ≈ 0.83), ahead of Vmax (0.67) and IKE (0.65). The per-fix IKE and PD are public, and climatlas reproduces them exactly.
2010 linkUses the same Extended Best Track and quadrant radii as §7.4. See the size & energy page.
Kreussler, P., Caron, L., et al.(2021). Tropical Cyclone Integrated Kinetic Energy in an Ensemble of HighResMIP Simulations. Geophysical Research Letters, 48, e2020GL090963. doi:10.1029/2020GL090963
Finer model grids produce smaller, more intense storms, but IKE per storm stays about the same. IKE is more robust to resolution than Vmax.
2010 linkBears on the reanalysis critique in §7.3.
Avenas, A., Mouche, A., et al.(2024). On the Tropical Cyclone Integrated Kinetic Energy Balance. Geophysical Research Letters, 51, e2024GL108327. doi:10.1029/2024GL108327
An energy-budget view of what makes IKE grow and decay.
Kang, N. & Elsner, J.(2015). Trade-off between intensity and frequency of global tropical cyclones. Nature Climate Change, 5, 661-664. doi:10.1038/nclimate2646
A global trade-off between storm frequency and intensity: fewer storms, but stronger ones.
Chen, B., Chen, B., et al.(2025). Constructing Deep Learning Datasets to Reveal Climate Trends of Tropical Cyclone Intensity and Structure Extremes. Artificial Intelligence for the Earth Systems, 4. doi:10.1175/AIES-D-24-0064.1
Deep-learning radial wind profiles (0–750 km) from satellite imagery, 1981–2020, allowing global IKE trend analysis.
2010 linkThe closest yet to the global size-aware PD record §7.4 set out to build.
Tropical cyclone size and wind structure
§7.4
Size went from an operational afterthought to a research field of its own: satellite climatologies, physically based wind profiles, and multi-decade reconstructions. The first size trends have now been detected.
Chavas, D. & Emanuel, K.(2010). A QuikSCAT climatology of tropical cyclone size. Geophysical Research Letters, 37, 2010GL044558. doi:10.1029/2010GL044558
The first global QuikSCAT climatology of outer size (the radius of 12 m/s winds). Size varies widely and depends only weakly on intensity.
2010 linkConfirms the Mireille-versus-Nat point in §7.4: intensity alone does not describe a storm.
Chan, K. & Chan, J.(2012). Size and Strength of Tropical Cyclones as Inferred from QuikSCAT Data. Monthly Weather Review, 140, 811-824. doi:10.1175/MWR-D-10-05062.1
Western North Pacific storms are the largest and most variable in size.
Chan, K. & Chan, J.(2015). Global climatology of tropical cyclone size as inferred from QuikSCAT data. International Journal of Climatology, 35, 4843-4848. doi:10.1002/joc.4307
The global version of the QuikSCAT size climatology, basin by basin.
Knaff, J., Longmore, S., & Molenar, D.(2014). An Objective Satellite-Based Tropical Cyclone Size Climatology. Journal of Climate, 27, 455-476. doi:10.1175/JCLI-D-13-00096.1
An objective, infrared-satellite size record (R5) for every basin, which allows size estimates where no radii were ever observed.
2010 linkA way to extend the Extended Best Track record used in §7.4.
Knaff, J., Slocum, C., et al.(2016). Using Routinely Available Information to Estimate Tropical Cyclone Wind Structure. Monthly Weather Review, 144, 1233-1247. doi:10.1175/MWR-D-15-0267.1
Estimates the wind radii from routinely available information (position, motion, intensity, IR size).
Chavas, D., Lin, N., & Emanuel, K.(2015). A Model for the Complete Radial Structure of the Tropical Cyclone Wind Field. Part I: Comparison with Observed Structure*. Journal of the Atmospheric Sciences, 72, 3647-3662. doi:10.1175/JAS-D-15-0014.1
CLE15: a physically based model of the complete radial wind profile, joining inner-core and outer-region solutions.
2010 linkThe physical successor to the modified Rankine vortex of Eq. 7.4.
Chavas, D., Lin, N., Dong, W., & Lin, Y.(2016). Observed Tropical Cyclone Size Revisited. Journal of Climate, 29, 2923-2939. doi:10.1175/JCLI-D-15-0731.1
An updated QuikSCAT size database. The environmental ratio of potential intensity to f explains size poorly, except perhaps its upper limit.
Sun, Y., Zhong, Z., et al.(2017). Impact of Ocean Warming on Tropical Cyclone Size and Its Destructiveness. Scientific Reports, 7, 8154. doi:10.1038/s41598-017-08533-6
In model experiments, ocean warming makes storms both stronger and larger. A size-aware power dissipation rises much faster than intensity alone would suggest.
2010 linkSupports §7.4: leaving size out underestimates destructive potential.
Schenkel, B., Lin, N., et al.(2018). Lifetime Evolution of Outer Tropical Cyclone Size and Structure as Diagnosed from Reanalysis and Climate Model Data. Journal of Climate, 31, 7985-8004. doi:10.1175/JCLI-D-17-0630.1
Outer size keeps growing after peak intensity over a storm's life.
Wang, S. & Toumi, R.(2022). An analytic model of the tropical cyclone outer size. npj Climate and Atmospheric Science, 5, 46. doi:10.1038/s41612-022-00270-6
An analytic, angular-momentum-based model of how the outer size (R34) grows.
Chavas, D. & Knaff, J.(2022). A Simple Model for Predicting the Tropical Cyclone Radius of Maximum Wind from Outer Size. Weather and Forecasting, 37, 563-579. doi:10.1175/WAF-D-21-0103.1
Predicts the radius of maximum wind from Vmax, R34 and latitude.
2010 linkSupplies the RMW, the hardest input to obtain for Eq. 7.4.
Gori, A., Lin, N., Schenkel, B., & Chavas, D.(2023). North Atlantic Tropical Cyclone Size and Storm Surge Reconstructions From 1950‐Present. Journal of Geophysical Research: Atmospheres, 128, e2022JD037312. doi:10.1029/2022JD037312
North Atlantic size reconstructed from 1950 onward (ERA5 outer size plus a wind model for RMW), checked against observations and storm tides.
2010 linkThe long size baseline that §7.4 said was missing.
Zhuo, J. & Tan, Z.(2023). A Deep-Learning Reconstruction of Tropical Cyclone Size Metrics 1981–2017: Examining Trends. Journal of Climate, 36, 5103-5123. doi:10.1175/JCLI-D-22-0714.1
Deep-learning reconstruction of size metrics for 1981–2017, used to examine trends.
Xu, Z., Guo, J., et al.(2024). Global tropical cyclone size and intensity reconstruction dataset for 1959–2022 based on IBTrACS and ERA5 data. Earth System Science Data, 16, 5753-5766. doi:10.5194/essd-16-5753-2024
A global, three-hourly reconstruction of size and intensity for 1959–2022 from IBTrACS and ERA5.
Balaguru, K., Chang, C., et al.(2026). Recent Tropical Cyclone Outer Size Increases in the Western North Atlantic. Earth's Future, 14, e2025EF007162. doi:10.1029/2025EF007162
Detected outer-size growth in the western North Atlantic: R34 near the U.S. East Coast increased about 7.5% over 1979–2022, attributed to both natural variability and external forcing.
2010 linkThe first detected size trend. It strengthens the case that power-dissipation trends need size.
Wang, P., Bernier, N., & Xie, S.(2026). Synthetic Aperture Radar (SAR)‐Based Evaluation of Tropical Cyclone Wind Profiles and a Theory‐Based Radius of Maximum Wind Estimation. Geophysical Research Letters, 53, e2026GL122677. doi:10.1029/2026GL122677
Tests wind-profile models against synthetic aperture radar (SAR) and proposes a theory-based estimate of the radius of maximum wind.
Willoughby, H., Darling, R., & Rahn, M.(2006). Parametric Representation of the Primary Hurricane Vortex. Part II: A New Family of Sectionally Continuous Profiles. Monthly Weather Review, 134, 1102-1120. doi:10.1175/MWR3106.1
The Willoughby double-exponential parametric vortex, a widely used step up from the Rankine vortex.
Holland, G., Belanger, J., & Fritz, A.(2010). A Revised Model for Radial Profiles of Hurricane Winds. Monthly Weather Review, 138, 4393-4401. doi:10.1175/2010MWR3317.1
Holland's revised radial wind profile, another standard parametric vortex.
Observing the surface wind field
§7.4
The H*Wind analyses used for Ivan and Ike became a commercial product (HWind Scientific, now part of Moody's RMS). Meanwhile, new satellites and curated datasets made the 2-D wind field more observable than ever.
Meissner, T., Ricciardulli, L., & Wentz, F.(2017). Capability of the SMAP Mission to Measure Ocean Surface Winds in Storms. Bulletin of the American Meteorological Society, 98, 1660-1677. doi:10.1175/BAMS-D-16-0052.1
SMAP's L-band radiometer measures winds above 70 m/s, through heavy rain.
2010 linkAn independent check on the 34- and 50-kt radii.
Ruf, C., Atlas, R., et al.(2016). New Ocean Winds Satellite Mission to Probe Hurricanes and Tropical Convection. Bulletin of the American Meteorological Society, 97, 385-395. doi:10.1175/BAMS-D-14-00218.1
CYGNSS: frequent wind retrievals through precipitation from reflected GNSS signals.
Razin, M., Slocum, C., et al.(2023). Tropical Cyclone Precipitation, Infrared, Microwave, and Environmental Dataset (TC PRIMED). Bulletin of the American Meteorological Society, 104, E1980-E1998. doi:10.1175/BAMS-D-21-0052.1
TC PRIMED: more than 176,000 satellite overpasses of 2,101 storms, with ERA5 environmental diagnostics, hosted on the cloud.
Liu, G., Jiang, S., et al.(2025). A Global ERA5-based Tropical Cyclone Wind Field Dataset Enhanced by Integrated Parametric Correction Methods. Scientific Data, 12, 1429. doi:10.1038/s41597-025-05789-w
A global ERA5-based wind-field dataset with parametric corrections in the inner core and at landfall.
Tropical cyclones in reanalyses
§7.3
Maue & Hart (2007) and §7.3 argued that 2000s-era reanalyses could not resolve tropical cyclone winds. Later reanalysis evaluations confirmed that for the inner core. They also found that outer size and storm location are captured reasonably well.
Schenkel, B. & Hart, R.(2012). An Examination of Tropical Cyclone Position, Intensity, and Intensity Life Cycle within Atmospheric Reanalysis Datasets. Journal of Climate, 25, 3453-3475. doi:10.1175/2011JCLI4208.1
Reanalyses place storms well but badly underestimate intensity, and the bias changes over time.
2010 linkConfirms the §7.3 critique.
Murakami, H.(2014). Tropical cyclones in reanalysis data sets. Geophysical Research Letters, 41, 2133-2141. doi:10.1002/2014GL059519
Reanalyses reproduce storm frequency and distribution reasonably well, but intensity is too weak.
Hodges, K., Cobb, A., & Vidale, P.(2017). How Well Are Tropical Cyclones Represented in Reanalysis Datasets?. Journal of Climate, 30, 5243-5264. doi:10.1175/JCLI-D-16-0557.1
Nearly every IBTrACS storm from 1979–2012 appears in all six reanalyses, but intensity is underrepresented.
Schenkel, B., Lin, N., et al.(2017). Evaluating Outer Tropical Cyclone Size in Reanalysis Datasets Using QuikSCAT Data. Journal of Climate, 30, 8745-8762. doi:10.1175/JCLI-D-17-0122.1
Outer size in reanalyses agrees well with QuikSCAT. CFSR and JRA-55 do best.
2010 linkThe key nuance: the inner core fails, the outer wind field works.
Bian, G., Nie, G., & Qiu, X.(2021). How well is outer tropical cyclone size represented in the ERA5 reanalysis dataset?. Atmospheric Research, 249, 105339. doi:10.1016/j.atmosres.2020.105339
ERA5 still underestimates outer size, more so for large storms.
Slocum, C., Razin, M., Knaff, J., & Stow, J.(2022). Does ERA5 Mark a New Era for Resolving the Tropical Cyclone Environment?. Journal of Climate, 35, 7147-7164. doi:10.1175/JCLI-D-22-0127.1
The environment around storms in ERA5 is useful but has known biases.
Dulac, W., Cattiaux, J., et al.(2024). Assessing the representation of tropical cyclones in ERA5 with the CNRM tracker. Climate Dynamics, 62, 223-238. doi:10.1007/s00382-023-06902-8
ERA5 detects storms well, but its maximum winds are biased low (grid spacing, sparse data near the storm center, the assimilation system).
2010 linkRaw reanalysis PD or IKE trends remain unreliable, as §7.3 concluded for ERA-40.
ENSO and basin teleconnections
§7.5
The 2010 composites of El Niño and La Niña genesis shifts have been refined. The flavor of El Niño (eastern versus central Pacific) and the Atlantic Meridional Mode both matter.
Patricola-DiRosario, C., Saravanan, R., & Chang, P.(2014). The Impact of the El Niño–Southern Oscillation and Atlantic Meridional Mode on Seasonal Atlantic Tropical Cyclone Activity. Journal of Climate, 27, 5311-5328. doi:10.1175/JCLI-D-13-00687.1
ENSO and the Atlantic Meridional Mode jointly shape Atlantic seasonal activity.
Patricola-DiRosario, C., Chang, P., & Saravanan, R.(2016). Degree of simulated suppression of Atlantic tropical
cyclones modulated by flavour of El Niño. Nature Geoscience, 9, 155-160. doi:10.1038/ngeo2624
An eastern-Pacific El Niño suppresses Atlantic storms far more than a central-Pacific (Modoki) event does.
Patricola, C., Saravanan, R., & Chang, P.(2017). A teleconnection between Atlantic sea surface temperature and eastern and central North Pacific tropical cyclones. Geophysical Research Letters, 44, 1167-1174. doi:10.1002/2016GL071965
Atlantic SST (the Atlantic Meridional Mode) modulates eastern and central North Pacific storms through a Walker-circulation response.
2010 linkA mechanism for the Eastern Pacific / Atlantic anticorrelation in §7.5.1 and §7.6.
Patricola-DiRosario, C., Camargo, S., et al.(2018). The Influence of ENSO Flavors on Western North Pacific Tropical Cyclone Activity. Journal of Climate, 31, 5395-5416. doi:10.1175/JCLI-D-17-0678.1
Western North Pacific ACE and the number of intense typhoons respond more to central-Pacific warming than to eastern-Pacific warming.
2010 linkRefines the El Niño genesis shift and high ACE described in §7.5.2 and §7.5.5.
Kossin, J., Emanuel, K., & Camargo, S.(2016). Past and Projected Changes in Western North Pacific Tropical Cyclone Exposure. Journal of Climate, 29, 5725-5739. doi:10.1175/JCLI-D-16-0076.1
The poleward shift of western North Pacific storms is strong and partly tied to the PDO and ENSO.
Song, J., Klotzbach, P., Wei, N., & Duan, Y.(2025). Asymmetric Impact of El Niño‐Southern Oscillation on Autumn Accumulated Cyclone Energy Over the Western North Pacific. Geophysical Research Letters, 52, e2025GL116661. doi:10.1029/2025GL116661
Autumn western North Pacific ACE drops sharply in La Niña but changes little in El Niño (1970–2023).
2010 linkCompare Table 7.2 and §7.5.7.
Sena, A., Patricola‐DiRosario, C., et al.(2025). Multidecadal Fluctuations in the Observed ENSO‐Tropical Cyclone Teleconnection. Geophysical Research Letters, 52, e2025GL116968. doi:10.1029/2025GL116968
The ENSO–tropical cyclone teleconnection fluctuates on multidecadal scales. It was strongest in the Atlantic from the 1980s to the mid-2000s.
2010 linkThe dissertation analyzed a period when the teleconnection was unusually strong.
Best-track data: reanalysis and homogeneity
§7.1, §7.7
The data-quality problems Chapter 7 kept returning to are being worked on. HURDAT2 has a new format and decades of reanalysis, most recently NOAA's September 2026 release covering 1971–1975. IBTrACS consolidated the global record, and uniform satellite intensity records now exist.
Landsea, C. & Franklin, J.(2013). Atlantic Hurricane Database Uncertainty and Presentation of a New Database Format. Monthly Weather Review, 141, 3576-3592. doi:10.1175/MWR-D-12-00254.1
Introduces the HURDAT2 format and quantifies uncertainty in position and intensity.
Delgado, S., Landsea, C., & Willoughby, H.(2018). Reanalysis of the 1954–63 Atlantic Hurricane Seasons. Journal of Climate, 31, 4177-4192. doi:10.1175/JCLI-D-15-0537.1
The reanalysis of the 1954–1963 Atlantic hurricane seasons. The Atlantic reanalysis has since advanced through 1975, with more than 3,000 revisions and 14 new storms in the 1971–75 release.
2010 linkclimatlas incorporates the 1971–75 revision.
Knapp, K., Kruk, M., et al.(2010). The International Best Track Archive for Climate Stewardship (IBTrACS). Bulletin of the American Meteorological Society, 91, 363-376. doi:10.1175/2009BAMS2755.1
IBTrACS: the global merged best-track archive (now v04r01).
Schreck, C., Knapp, K., & Kossin, J.(2014). The Impact of Best Track Discrepancies on Global Tropical Cyclone Climatologies using IBTrACS. Monthly Weather Review, 142, 3881-3899. doi:10.1175/MWR-D-14-00021.1
Differences among forecasting agencies (including 1-minute versus 10-minute winds) change global climatologies substantially.
2010 linkConfirms the heterogeneity concern in §7.7.
Kossin, J., Olander, T., & Knapp, K.(2013). Trend Analysis with a New Global Record of Tropical Cyclone Intensity. Journal of Climate, 26, 9960-9976. doi:10.1175/JCLI-D-13-00262.1
ADT-HURSAT: a homogeneous global intensity record for trend analysis.
Extratropical transition and warm seclusions
§2.4, §4.2
Extratropical transition (ET) received two community reviews, global phase-space climatologies and projections for a warmer climate. Hurricane Sandy (2012) became the textbook case of warm-seclusion reintensification.
Evans, C., Wood, K., et al.(2017). The Extratropical Transition of Tropical Cyclones. Part I: Cyclone Evolution and Direct Impacts. Monthly Weather Review, 145, 4317-4344. doi:10.1175/MWR-D-17-0027.1
Review, Part I: how tropical cyclones evolve through ET and the hazards they bring.
2010 linkThe modern reference frame for §2.4.
Keller, J., Grams, C., et al.(2019). The Extratropical Transition of Tropical Cyclones. Part II: Interaction with the Midlatitude Flow, Downstream Impacts, and Implications for Predictability. Monthly Weather Review, 147, 1077-1106. doi:10.1175/MWR-D-17-0329.1
Review, Part II: ET's interaction with the midlatitude flow, downstream impacts and predictability.
2010 linkThe downstream-development side of §4.2 (Typhoon Lupit).
Bieli, M., Camargo, S., et al.(2019). A Global Climatology of Extratropical Transition. Part I: Characteristics across Basins. Journal of Climate, 32, 3557-3582. doi:10.1175/JCLI-D-17-0518.1
A global cyclone-phase-space climatology of ET in modern reanalyses.
2010 linkBrings the Hart (2003) phase-space diagnosis used in the dissertation up to date.
Bieli, M., Camargo, S., et al.(2019). A Global Climatology of Extratropical Transition. Part II: Statistical Performance of the Cyclone Phase Space. Journal of Climate, 32, 3583-3597. doi:10.1175/JCLI-D-18-0052.1
Part II: statistical characteristics and how phase-space ET compares with best-track labels.
Bieli, M., Sobel, A., Camargo, S., & Tippett, M.(2020). A Statistical Model to Predict the Extratropical Transition of Tropical Cyclones. Weather and Forecasting, 35, 451-466. doi:10.1175/WAF-D-19-0045.1
A statistical model to predict whether and when ET will happen.
Zarzycki, C., Thatcher, D., & Jablonowski, C.(2017). Objective tropical cyclone extratropical transition detection in high‐resolution reanalysis and climate model data. Journal of Advances in Modeling Earth Systems, 9, 130-148. doi:10.1002/2016MS000775
Objective ET detection in high-resolution reanalysis and climate-model data.
Kofron, D., Ritchie, E., & Tyo, J.(2010). Determination of a Consistent Time for the Extratropical Transition of Tropical Cyclones. Part I: Examination of Existing Methods for Finding “ET Time”. Monthly Weather Review, 138, 4328-4343. doi:10.1175/2010MWR3180.1
A consistent, objective definition of when ET occurs.
Liu, M., Vecchi, G., Smith, J., & Murakami, H.(2017). The Present-Day Simulation and Twenty-First-Century Projection of the Climatology of Extratropical Transition in the North Atlantic. Journal of Climate, 30, 2739-2756. doi:10.1175/JCLI-D-16-0352.1
A high-resolution model projects more North Atlantic ET events by the late 21st century.
Michaelis, A. & Lackmann, G.(2019). Climatological Changes in the Extratropical Transition of Tropical Cyclones in High-Resolution Global Simulations. Journal of Climate, 32, 8733-8753. doi:10.1175/JCLI-D-19-0259.1
In warmer climates, more storms reach the midlatitudes and transition, and they stay stronger after ET.
2010 linkImplies more warm-seclusion reintensification of the kind in §2.4.
Jung, C. & Lackmann, G.(2023). Changes in Tropical Cyclones Undergoing Extratropical Transition in a Warming Climate: Quasi‐Idealized Numerical Experiments of North Atlantic Landfalling Events. Geophysical Research Letters, 50, e2022GL101963. doi:10.1029/2022GL101963
Changes in ET storms in a warmer climate.
Sarro, G. & Evans, C.(2022). An Updated Investigation of Post-Transformation Intensity, Structural, and Duration Extremes for Extratropically Transitioning North Atlantic Tropical Cyclones. Monthly Weather Review, 150, 2911-2933. doi:10.1175/MWR-D-22-0088.1
Documents which transitioning North Atlantic storms become the strongest, largest and longest-lived afterward. Shapiro–Keyser (warm seclusion) evolutions are among the most intense.
2010 linkThe most direct modern follow-up to §2.4.
Studholme, J., Fedorov, A., et al.(2022). Poleward expansion of tropical cyclone latitudes in warming climates. Nature Geoscience, 15, 14-28. doi:10.1038/s41561-021-00859-1
Tropical cyclone latitudes are expanding poleward as the climate warms.
Hurricane Sandy (2012) reintensified at landfall through an extratropical warm-core seclusion.
2010 linkA textbook case of the dissertation's central mechanism.
Haarsma, R., Hazeleger, W., et al.(2013). More hurricanes to hit western Europe due to global warming. Geophysical Research Letters, 40, 1783-1788. doi:10.1002/grl.50360
More hurricane-force storms of tropical origin are projected to reach western Europe.
Sainsbury, E., Schiemann, R., et al.(2020). How Important Are Post‐Tropical Cyclones for European Windstorm Risk?. Geophysical Research Letters, 47, e2020GL089853. doi:10.1029/2020GL089853
Post-tropical cyclones make up a large share of Europe's strongest early-autumn windstorms.
Sainsbury, E., Schiemann, R., et al.(2022). Why Do Some Post-Tropical Cyclones Impact Europe?. Monthly Weather Review, 150, 2553-2571. doi:10.1175/MWR-D-22-0111.1
Why some post-tropical cyclones reach Europe: the jet stream and how the storm moves through ET.
Baker, A., Hodges, K., Schiemann, R., & Vidale, P.(2021). Historical Variability and Lifecycles of North Atlantic Midlatitude Cyclones Originating in the Tropics. Journal of Geophysical Research: Atmospheres, 126, e2020JD033924. doi:10.1029/2020JD033924
The variability and life cycles of North Atlantic midlatitude cyclones that began in the tropics.
Schultz, D. & Sienkiewicz, J.(2013). Using Frontogenesis to Identify Sting Jets in Extratropical Cyclones. Weather and Forecasting, 28, 603-613. doi:10.1175/WAF-D-12-00126.1
Frontolysis on the bent-back front helps identify sting jets in Shapiro–Keyser cyclones.
Clark, P. & Gray, S.(2018). Sting jets in extratropical cyclones: a review. Quarterly Journal of the Royal Meteorological Society, 144, 943-969. doi:10.1002/qj.3267
A review of sting jets and their link to the frontal-fracture and seclusion stages.
Seiler, C. & Zwiers, F.(2016). How will climate change affect explosive cyclones in the extratropics of the Northern Hemisphere?. Climate Dynamics, 46, 3633-3644. doi:10.1007/s00382-015-2791-y
Priestley, M. & Catto, J.(2022). Future changes in the extratropical storm tracks and cyclone intensity, wind speed, and structure. Weather and Climate Dynamics, 3, 337-360. doi:10.5194/wcd-3-337-2022
CMIP6 projections of storm-track position, cyclone intensity, wind and structure.
Kinetic energy budgets of transitioning storms
§4.2
The local eddy kinetic energy framework applied to Typhoon Lupit (2009) has become a standard way to diagnose how ET feeds downstream development and forecast error. No published energetics study of Lupit itself has appeared since.
Keller, J., Jones, S., & Harr, P.(2014). An Eddy Kinetic Energy View of Physical and Dynamical Processes in Distinct Forecast Scenarios for the Extratropical Transition of Two Tropical Cyclones*. Monthly Weather Review, 142, 2751-2771. doi:10.1175/MWR-D-13-00219.1
Eddy kinetic energy budgets distinguish forecast scenarios in which ET energy does or does not spread downstream.
2010 linkThe same framework as §4.2.2.
Kwon, Y. & Son, S.(2026). Local Energetics of Extratropical Transition: A Case Study of Typhoon Hagibis (2019). Journal of the Atmospheric Sciences, 83, 1661-1680. doi:10.1175/JAS-D-26-0015.1
Local energetics of the ET of Typhoon Hagibis (2019).
2010 linkThe closest modern analogue to the Lupit case study.
Battalio, J. & Lora, J.(2024). Increases in the Local Eddy Energetics of the Extratropical Atmosphere over the Last Four Decades. Journal of Climate, 37, 3283-3304. doi:10.1175/JCLI-D-22-0930.1
Midlatitude local eddy energy conversions have increased over four decades in reanalyses.
Von Ahn, J., Sienkiewicz, J., & Chang, P.(2006). Operational Impact of QuikSCAT Winds at the NOAA Ocean Prediction Center. Weather and Forecasting, 21, 523-539. doi:10.1175/WAF934.1
(2006, context) QuikSCAT showed that hurricane-force winds are common in extratropical cyclones, and the NOAA Ocean Prediction Center built its hurricane-force cyclone climatology on that finding.
Part III
Built since, and what comes next
Much of what §7.7 proposed, real-time global ACE monitoring and size-aware power dissipation,
now runs on climatlas. These are the next steps.
Extend the NATL/EPAC structure layer to every basin. Combine best-track Vmax with reconstructed R34 (Xu et al. 2024; Gori et al. 2023; Knaff IR size) and RMW from Chavas & Knaff (2022), and swap the Rankine profile for CLE15. That gives the global PD versus PDI comparison §7.3–7.4 asked for.
§7.4
How much does the wind profile matter?
Recompute PD and IKE for Ivan, Ike and Mireille/Nat with Rankine, Holland (2010), Willoughby (2006) and CLE15 profiles, and publish the spread as an uncertainty band on every storm page.
§7.4
New truth for wind swaths
H*Wind is no longer public. Validate the modeled footprints against SMAP/SMOS, SAR, SFMR and CYGNSS, using TC PRIMED for the collocations.
size
Homogenize the size record
Correct for operational-era radii (pre-2004), the arrival of scatterometers, and changes in NHC and JTWC practice before interpreting trends. Test whether the western North Atlantic R34 increase (Balaguru et al. 2026) appears in other basins.
§7.5
Seasonal and real-time IKE
Carry TIKE (Misra et al. 2013) and SPIKE-style forecasts next to ACE on the live page, and ask whether IKE has seasonal predictability beyond ENSO.
§7.6–7.7
Decompose the record low
Re-run the 2007–2010 analysis through 2026 in calendar and July–June windows. Split global ACE into ENSO, IPO and residual parts (Shan et al. 2025), and track the Atlantic–Pacific antiphase with running correlations against the Atlantic Meridional Mode.
§7.5
ENSO flavors, all basins
Composite ACE, genesis centroids and ACE-weighted latitude for eastern- versus central-Pacific El Niño in every basin, and test the La Niña asymmetry of Song et al. (2025) year-round.
§7.2
The duration component, dissected
Split ACE into count, days per storm and intensity per basin. Check whether the rise in short-lived named storms or any change in translation speed shows up in each part.
§7.7
Satellite-consistent ACE
Compute ACE from ADT-HURSAT intensities and compare it with each agency's best-track ACE, to measure how much agency practice (1- versus 10-minute winds) shapes trends.
§2.4
Post-tropical ACE and a warm-seclusion ET climatology
Define an ACE/PD companion index for the extratropical phase of a storm's life. Build an ERA5 (1940–present) climatology of warm-seclusion reintensification after ET using phase space plus a seclusion criterion, and compare it with Sarro & Evans (2022) and Bieli et al. (2019).
§4.2
Lupit, revisited
Redo the §4.2 eddy kinetic energy budget in ERA5 with the Kwon & Son (2026) framework, and compare Lupit with Hagibis (2019) and with ET cases that are strongly versus weakly coupled to the downstream flow.
§2.4
Phase space on every storm page
Add a cyclone-phase-space trajectory and an ET-stage indicator to each storm page, back-filled from ERA5 and live from GFS/ECMWF.